
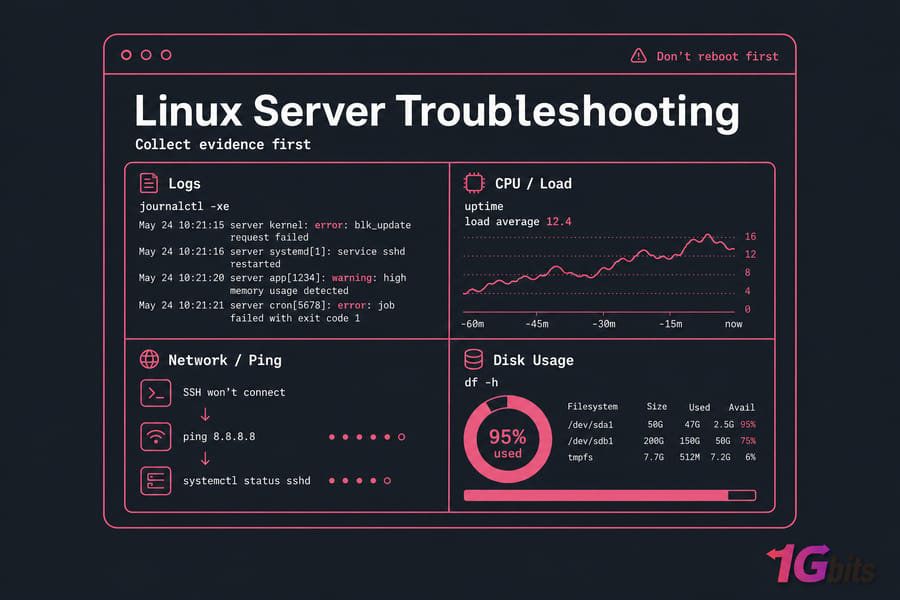
Your server's acting up. Maybe the site's down, SSH won't connect, or the dashboard shows load averages climbing into double digits. Whatever the symptom, Linux server troubleshooting comes down to one thing: working through a calm, evidence-first checklist instead of randomly restarting services and hoping for the best.
I've been doing this long enough to tell you that the rebooters always lose. They lose data, lose evidence, and usually lose more time than they would've spent just running journalctl -xe first. This guide is the workflow I'd hand a junior engineer on day one symptom, cause, verification, fix covering SSH, CPU, RAM, disk, DNS, network, and services.
Quick Answer
Linux server troubleshooting starts with triage: confirm whether the server is reachable, check system load, disk space, memory, running services, and logs, then test network and DNS. Use commands like uptime, df -h, free -m, systemctl status, and journalctl to identify the root cause before restarting anything.
Key takeaway: Don't reboot first. Collect evidence first. A reboot wipes the symptoms you needed to diagnose the problem.
Before You Begin
- SSH or provider console access (you'll want both available)
- Sudo or root privileges
- A recent backup or snapshot — non-negotiable if you plan to edit configs
- Know your distro family. Debian/Ubuntu uses
apt; CentOS, AlmaLinux, and Rocky usednforyum - Helpful extras installed:
htop,curl,dig,net-tools,iotop
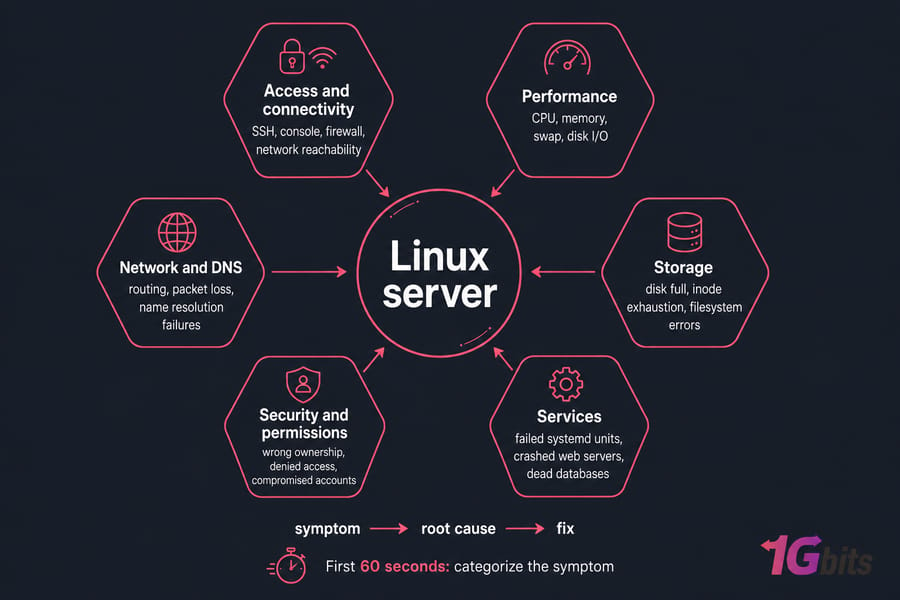
What Linux Server Troubleshooting Actually Means
Troubleshooting is the structured process of moving from a symptom ("the site is slow") to a verified root cause ("MySQL is swapping because a runaway backup job is hogging RAM") and finally to a fix. It's not the same as restarting things until they behave. That's superstition.
Most Linux server issues fall into one of six buckets, and recognizing the bucket fast is half the battle:
- Access and connectivity — SSH, console, firewall, network reachability
- Performance — CPU, memory, swap, disk I/O
- Storage — disk full, inode exhaustion, filesystem errors
- Services — failed systemd units, crashed web servers, dead databases
- Security and permissions — wrong ownership, denied access, compromised accounts
- Network and DNS — routing, packet loss, name resolution failures
If you can categorize the symptom in the first 60 seconds, you've already cut your investigation time in half. If you're newer to this and want a refresher on the underlying basics, our overview of what a Linux server is covers the moving parts you'll be poking at.
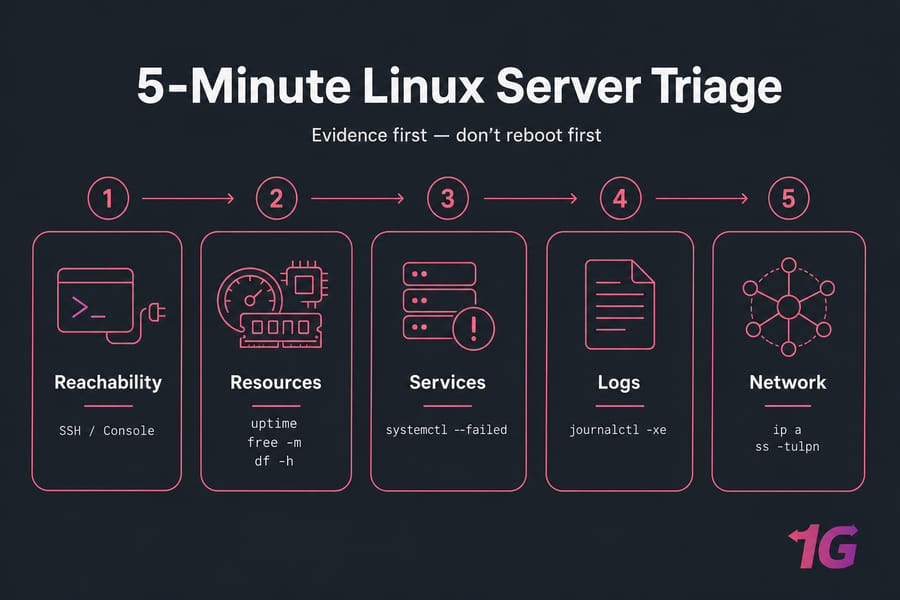
First Checks: How to Troubleshoot a Linux Server in Five Minutes
Here's the question to ask first: is the entire server down, or is one service misbehaving? That distinction changes everything. If you can SSH in but the site is broken, it's a service or application problem. If you can't SSH in at all, you're looking at a network, firewall, or full-system issue — and you'll likely need provider console access.
Once you're in, run these in order. Don't skip any of them. The whole sweep takes about five minutes.
| Command | What it checks | Bad signs | Next action |
uptime |
How long the server's been up and load average | Recent reboot you didn't trigger; load average > CPU core count | Check dmesg for kernel events; investigate top processes |
top or htop |
Live CPU, RAM, and process activity | Single process pegging CPU; high %wa (I/O wait) |
Identify the process, check its logs |
free -m |
Memory and swap usage | Swap heavily used; available memory near zero | Find memory hogs with ps aux --sort=-%mem |
df -h |
Disk usage per mounted filesystem | Any partition at 95%+ or "100% full" | Drill into /var/log, Docker, backups with du |
systemctl --failed |
Crashed or failed systemd services | Any unit listed as failed | Run journalctl -u <unit> for details |
ip a |
Network interfaces and IP addresses | Missing interface; no IP on the expected NIC | Check network config, restart networking carefully |
ss -tulpn |
Listening TCP/UDP ports and the processes behind them | Expected service not listening (no port 22, 80, 443, etc.) | Check the service status and config |
who |
Active sessions | Unknown user logged in | Investigate for compromise; check auth logs |
Think of this as your five-minute triage framework: reachability, resources, failed services, recent logs, network. If you do nothing else from this guide, do this. For the underlying syntax of any of these tools, our basic Linux commands reference and the deeper top command guide have you covered.
Pro tip: If SSH is dead, don't assume the whole server is gone. Hit the provider console or rescue mode first. Half the time, the box is fine — sshd just won't start because of a config typo or a firewall rule.
Linux Server Log Analysis: Where the Evidence Lives
Logs are non-negotiable. Before you change a single config file, read what the server is already telling you. Most "mysterious" outages have a perfectly clear explanation buried in journalctl or /var/log — you just have to look.
Using journalctl
Modern Linux distros use systemd, and journalctl is your one-stop shop for nearly everything. A few patterns I use daily:
journalctl -xe— recent errors with explanations, perfect for "something just broke"journalctl -u nginx— logs for a specific service unitjournalctl --since "10 minutes ago"— narrow by time windowjournalctl -p err -b— only errors since the last bootjournalctl -k— kernel messages (same asdmesg)
Classic /var/log paths
| Log path | What it shows | Typical use case |
/var/log/syslog (Debian/Ubuntu) |
General system messages | Service crashes, daemon errors |
/var/log/messages (RHEL/AlmaLinux/Rocky) |
General system messages | Same as syslog on Debian-family |
/var/log/auth.log or /var/log/secure |
Authentication events | SSH login failures, sudo usage, intrusion attempts |
/var/log/nginx/error.log |
NGINX errors | Upstream failures, 502s, config issues |
/var/log/apache2/error.log or /var/log/httpd/error_log |
Apache errors | PHP-FPM issues, vhost problems |
/var/log/mysql/error.log |
MySQL/MariaDB errors | Crashes, corrupt tables, OOM kills |
The trick is to correlate timestamps. If users started reporting issues at 14:32, search for that timeframe across multiple logs. The cause usually appears 30–120 seconds before the symptom. Need more on parsing these files? Check our deeper Linux logs guide.
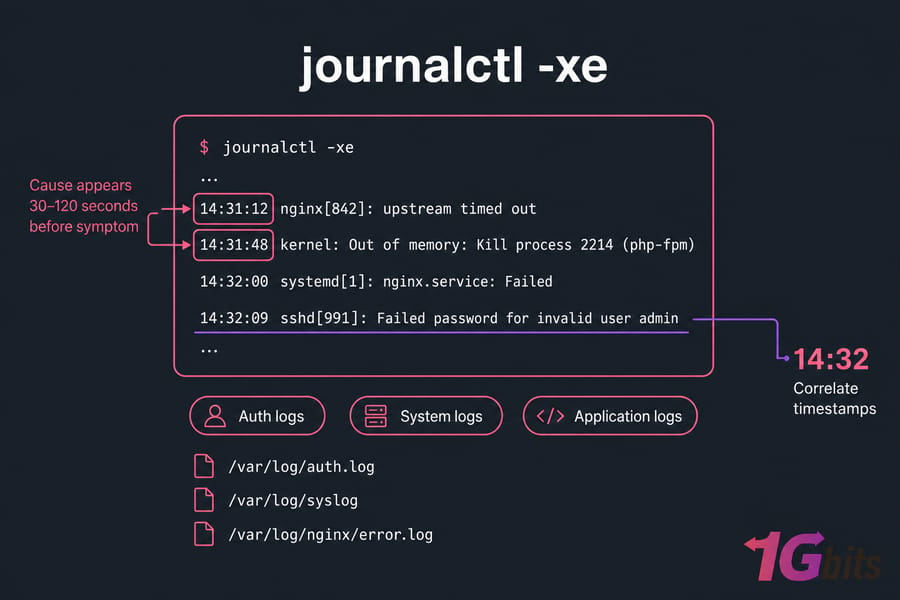
Quick summary: Auth logs explain access issues. System logs explain service and kernel failures. Application logs explain the application's own complaints. Check all three when timelines are unclear.
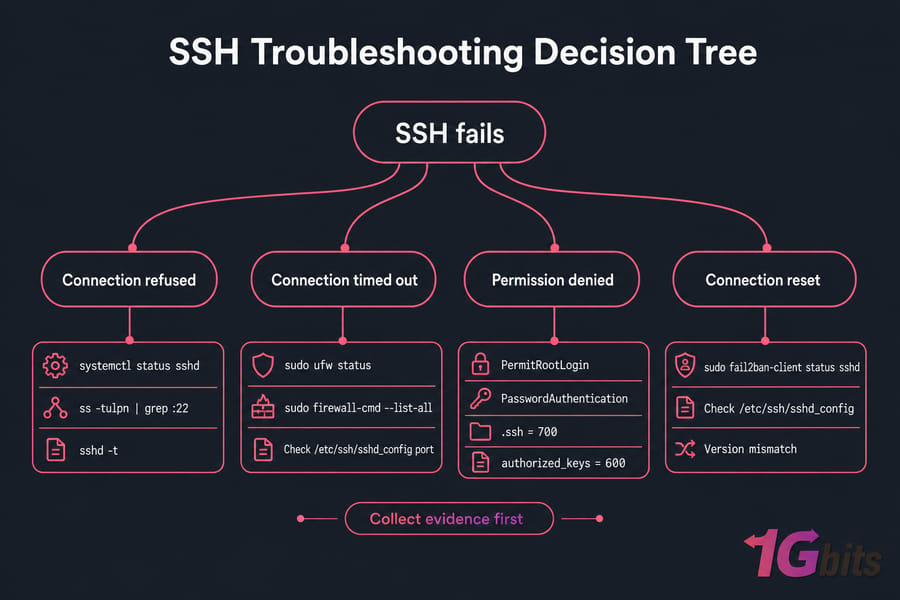
Linux SSH Troubleshooting: When You Can't Get In
SSH problems are the most stressful because they often gate every other fix. Take a breath. Then categorize the failure precisely — because "SSH doesn't work" can mean four very different things.
The four SSH failure modes
- Connection refused — the server is up but nothing is listening on port 22 (or your custom port). Usually sshd is stopped or the port changed.
- Connection timed out — packets aren't reaching sshd. Firewall, security group, routing, or the server's actually down.
- Permission denied (publickey) — sshd is responding, but your key isn't being accepted.
- Connection reset by peer — sshd dropped you mid-handshake. Often
fail2ban, bad config, or version mismatch.
Verification steps
If you have console access, run these on the server:
systemctl status sshd      # is the service running?
ss -tulpn | grep :22       # is anything listening on port 22?
sudo ufw status            # Ubuntu firewall rules
sudo firewall-cmd --list-all   # AlmaLinux/Rocky firewall
sudo fail2ban-client status sshd   # are you banned?
Check /etc/ssh/sshd_config for the actual port, PermitRootLogin, and PasswordAuthentication settings. If you recently edited it, run sshd -t to validate the config before restarting. A broken sshd_config that won't load is a classic lockout cause.
Key-based auth failures
The two killers here are permissions and the wrong key. On the server, .ssh must be 700 and ~/.ssh/authorized_keys must be 600, owned by the user. Anything looser and sshd silently refuses to use them.
For the deeper dive on specific errors, we've got dedicated guides for SSH connection refused and connection reset by peer. And if you're new to SSH entirely, start with how to SSH into a Linux server.
Linux Performance Troubleshooting: High CPU, RAM, and Load
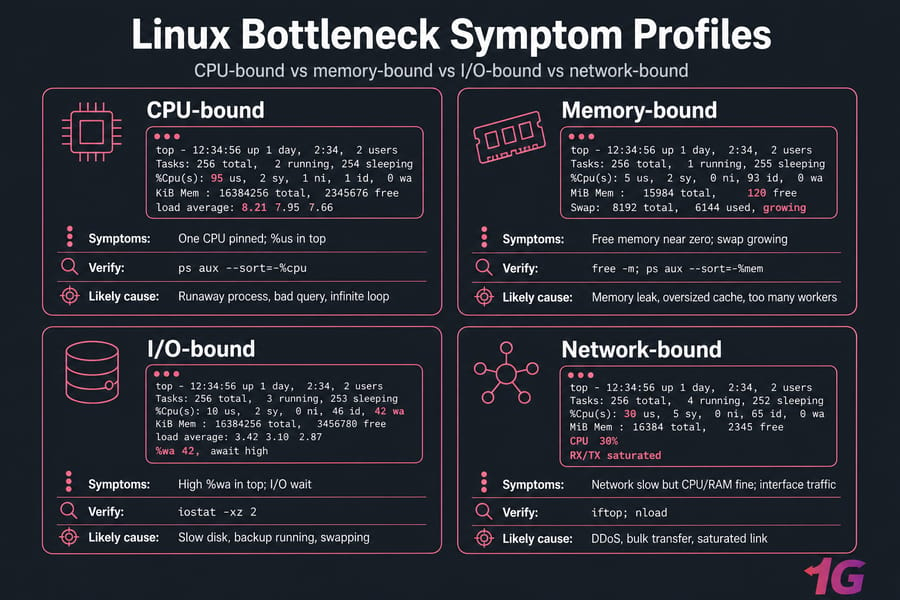
"The server is slow" is the vaguest complaint in operations. Your job is to translate it into a specific bottleneck: CPU, memory, disk I/O, or network. They look similar from the outside and require completely different fixes.
Reading load average
Load average — those three numbers from uptime — represents the average number of processes wanting CPU time over 1, 5, and 15 minutes. The rough rule: divide by your CPU core count. A load of 4.0 on a 4-core box means you're fully utilized but not drowning. A load of 16.0 on the same box means you've got serious queueing.
But load includes processes waiting on disk I/O too, which is why top's %wa column matters. High %wa means your CPU is sitting idle while waiting for storage. That's not a CPU problem — it's a disk problem.
Finding the culprit
ps aux --sort=-%cpu | head    # top CPU consumers
ps aux --sort=-%mem | head    # top memory consumers
vmstat 2 5                    # 5 samples, 2 seconds apart
iostat -xz 2                  # disk I/O detail (sysstat package)
Bottleneck matrix
| Symptom | Metric to check | Command | Likely cause |
| One CPU pinned | %us in top |
ps aux --sort=-%cpu |
Runaway process, bad query, infinite loop |
| All CPUs busy, load climbing | load average vs cores | uptime, htop |
Traffic spike, undersized server |
| Free memory near zero, swap growing | free -m |
ps aux --sort=-%mem |
Memory leak, oversized cache, too many workers |
High %wa in top |
I/O wait | iostat -xz 2 |
Slow disk, backup running, swapping |
| Network slow but CPU/RAM fine | interface traffic | iftop, nload |
DDoS, bulk transfer, saturated link |
One pattern I see constantly: the server "feels slow" but CPU is at 30%. Check swap. If you're swapping, every memory access is hitting disk and the server crawls. Either add RAM, fix the leaking process, or tune the workload. There's no third option.
For deeper dives, our writeups on VPS performance bottlenecks and improving VPS server speed are good follow-ups once you've found the bottleneck.
Linux Disk Space Troubleshooting
"No space left on device" is a classic 3 a.m. wake-up. The fix is straightforward, but the path there has a few traps worth knowing.
Start wide, then narrow
df -h           # overview of filesystems
df -i           # inode usage — don't skip this
du -xh / 2>/dev/null | sort -h | tail -20    # 20 biggest paths on root fs
The -x flag on du stops it from crossing filesystem boundaries, which is what you want. Otherwise it'll wander into /proc and other virtual filesystems and confuse you.
Inode exhaustion: the sneaky one
If df -h shows 60% used but you're getting "no space" errors, run df -i. You've probably run out of inodes — usually from millions of tiny session files, mail queue messages, or cache files. The fix is to find and delete the directory full of tiny files, not to expand storage.
The usual suspects
| Symptom | Likely cause | Verify with | Safe fix |
/var at 100% |
Runaway logs | du -sh /var/log/* |
Rotate logs, truncate old ones, fix the noisy app |
/ filling up after Docker use |
Old images, stopped containers, dangling volumes | docker system df |
docker system prune — carefully |
| Package cache bloat | apt or dnf cache | du -sh /var/cache/apt /var/cache/dnf |
apt clean or dnf clean all |
Mystery growth in /tmp |
App not cleaning up | du -sh /tmp/* |
Restart the app, fix temp handling |
| Inode count maxed | Millions of small files | df -i then find /path -xdev -type f | wc -l |
Delete or archive the file pile |
Warning: Don't delete files in/var,/etc, or anywhere under/usrif you don't recognize them. Truncating a log with: > /var/log/big.logis safer thanrmbecause it preserves the file handle that the running process is writing to.
If cleanup gets you nowhere, the real fix is more disk. Our guide on extending partition size in Linux walks through the safe path. For more on disk usage commands, the df command in Linux writeup goes deeper.
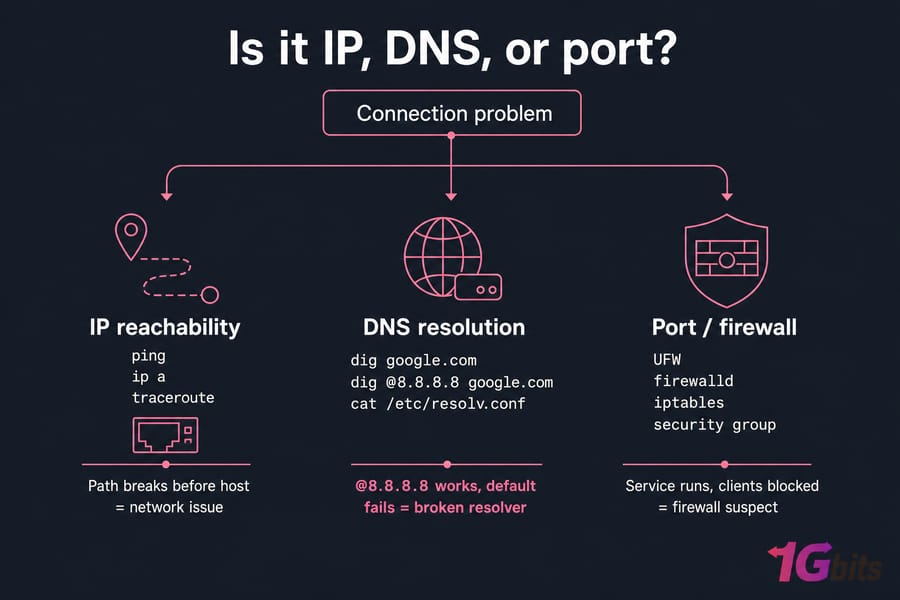
Linux Network and DNS Troubleshooting
Network issues split cleanly into three categories: the server itself can't talk to the world, the world can't reach the server, or name resolution is broken while the IP layer is fine. Knowing which one you're in saves time.
Confirm the basics
ip a              # interfaces and IPs
ip route          # default gateway
ping -c 4 8.8.8.8         # raw IP reachability
ping -c 4 google.com      # DNS + reachability
traceroute 8.8.8.8         # where packets die
ss -tulpn         # what's listening
If ping 8.8.8.8 works but ping google.com fails, you've got a DNS problem — not a network problem. That's a different fix entirely.
DNS-specific checks
Use dig and nslookup to ask DNS questions explicitly:
dig google.com
dig @8.8.8.8 google.com    # ask Google's resolver directly
cat /etc/resolv.conf        # what resolvers is the server using?
If dig @8.8.8.8 works but the default one fails, your configured resolver is broken. Our dig command guide and nslookup walkthrough cover the output in detail, and if you need to update your resolvers, see how to change Linux DNS. For the dreaded "temporary failure in name resolution" error, we have a dedicated fix.
Port and firewall checks
If the service is running but external clients can't reach it, the firewall is suspect. Check both the OS firewall (UFW, firewalld, or iptables) and any provider-side security group. The open ports in Linux guide walks through the verification commands. Also worth keeping traceroute in your back pocket — it tells you exactly where the path breaks. And for ongoing visibility, monitoring network traffic is a habit worth building.
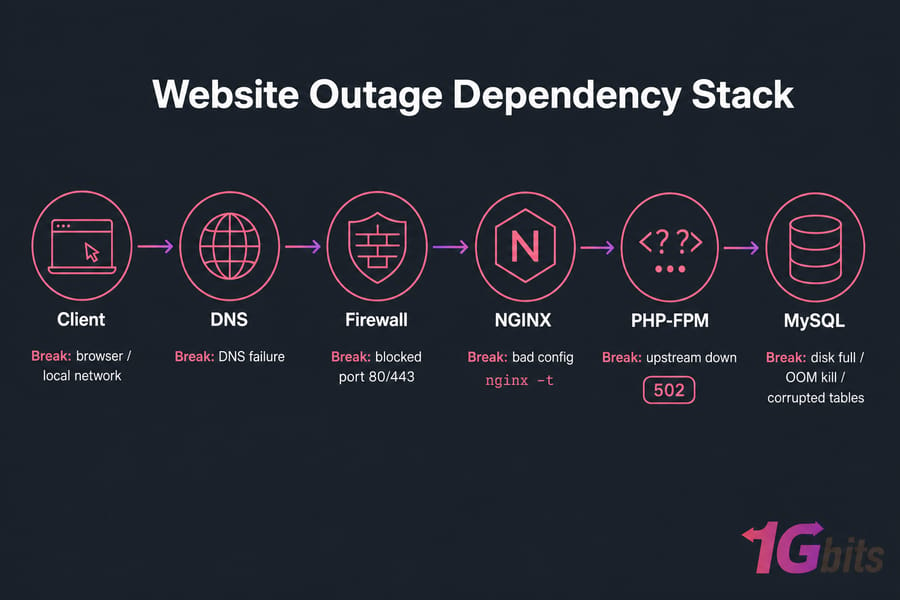
Linux Service Troubleshooting: systemd, NGINX, Apache, Databases, Docker
When the server itself is healthy but the application is down, you're dealing with a service-layer problem. Think of a website outage as a chain: DNS → firewall → web server → app runtime → database. Any broken link kills the whole thing, so test the chain in order.
systemd basics
systemctl status nginx
systemctl restart nginx
systemctl list-units --failed
journalctl -u nginx --since "1 hour ago"
The status output tells you the last few log lines, the PID, and whether the service crashed or never started. If it crashed, journalctl -u gives you the full picture.
NGINX and Apache
For NGINX, always run nginx -t before reloading. It validates the config and tells you the exact line where you broke things. If you're seeing 502s, the upstream PHP-FPM or app server is the culprit nine times out of ten see our 502 Bad Gateway fix guide.
For Apache, apachectl configtest is the equivalent check, and our restart Apache guide covers the safe restart patterns.
MySQL and MariaDB
If the database won't start, the cause is usually one of three things: disk full, out-of-memory kill, or corrupted tables. Check /var/log/mysql/error.log first, then verify with:
systemctl status mariadb
ss -tulpn | grep 3306
journalctl -u mariadb --since today
An OOM kill shows up in dmesg as "Out of memory: Killed process". If you see that, you've got a memory sizing problem, not a database problem.
Docker
For containerized workloads, docker ps -a shows stopped containers, docker logs <container> shows their output, and docker system df reveals how much disk Docker is hogging. Our Docker basic commands reference covers the essentials.
Common Linux Server Troubleshooting Mistakes
I've made every one of these. So has every sysadmin I respect. The trick is recognizing them as they happen and stopping yourself.
- Rebooting before collecting evidence. Reboots destroy the transient state that explains what went wrong. Always run your triage first.
- Changing multiple variables at once. If you tweak the firewall, edit sshd_config, and restart networking simultaneously, you'll never know which change broke (or fixed) the box.
- Editing configs without backup. Run
cp /etc/nginx/nginx.conf /etc/nginx/nginx.conf.bakbefore touching anything. It takes two seconds and saves outages. - Ignoring permissions and ownership. "Permission denied" rarely means what beginners think it means. Check the file's owner, group, and mode. Our writeups on permission denied errors and the chown command are worth bookmarking.
- Assuming the host is at fault. Sometimes it is. Most of the time it isn't. Verify on your side before opening a ticket.
- Not documenting what changed. Even a quick note in a scratch file ("17:42 — edited sshd_config, changed port to 2222") prevents hours of confusion later.
- Testing only from outside. If the site won't load, test from inside the server too:
curl -I http://localhost. That tells you if the problem is local or network-side.
Warning: Unexplained CPU spikes plus unknown processes plus strange outbound traffic equals possible compromise. Preserve the logs, rotate credentials, and read up on securing your server before doing anything else.
When to Stop Troubleshooting and Escalate
There's a point where DIY stops being smart. If you hit any of these, step back:
- Repeated kernel panics or filesystem corruption errors in
dmesg - SSH is dead, service is down, and the provider console shows nothing useful
- Suspected compromise (unknown users, weird outbound connections, modified system binaries)
- The same incident has recurred three times this month with no clear root cause
Your escalation toolkit
- Restore from snapshot or backup. If you have a clean snapshot from this morning, restoring is often faster than chasing the bug. If you don't have snapshots set up yet, fix that today — scheduling automatic backups takes 20 minutes and saves entire weekends.
- Use rescue mode or the provider console. When SSH is dead, the console is your lifeline. It boots the OS in a minimal state so you can fix configs, reset firewalls, or mount the filesystem from a recovery image.
- Open a support ticket. Provide what you've already checked. Good support engineers can move fast when you hand them logs, timestamps, and a clear summary of changes.
When managed hosting earns its keep
If you're spending nights on Linux incidents instead of building your product, managed hosting is doing the math in your favor. Managed VPS plans bundle monitoring, patching, and human support so you're not the only line of defense at 2 a.m. Our managed VPS option is built for exactly this — and if your workload has outgrown shared resources, a Linux dedicated server gives you the full hardware and the headroom to stop fighting fires.
For full control with sensible pricing, our Linux VPS plans include full root access, NVMe storage, and predictable resources. And if you need help fast, our support team is available 24/7.

Leave A Comment