![How to Monitor Linux Network Traffic? [Linux Network Monitor]](https://1gbits.com/cdn-cgi/image/width=1200,quality=80,format=auto/https://s3.1gbits.com/blog/2021/02/how-to-monitor-network-traffic-on-linux802-847xAuto.jpg "How to Monitor Linux Network Traffic? [Linux Network Monitor]")
Why should you monitor network traffic on Linux? As your business expands, the number of requests to your site will increase. This results in creating an influx of network traffic to the website. If no preventive actions are taken immediately, you might face serious repercussions.
To avoid malfunctions and ensure the overall quality, consider monitoring network traffic performance. This continuous monitoring approach will allow you to check why the network is running slow and find the issue’s culprit.
Several monitoring tools can be used in all Linux distributions to check bandwidth usage and other network diagnostics.
Monitoring tools allow you to check the traffic flowing through the network and measure transferring data’s speed. It will enable you to monitor the traffic flow, both incoming and outgoing traffic within the network.
Linux offers you some commands to install these tools to linux monitor network traffic that gives you information about which process is overusing the network bandwidth.
Not all tools are equal, and each tool offers different features. Different tools provide different processes for generating a traffic report for analysis purposes.
This tutorial will go through some of the main tools that can be used to monitor network traffic on Linux Servers. You can also linux vps hosting to practice it on a routine basis.
List of Commands for Monitoring Linux Network Traffic
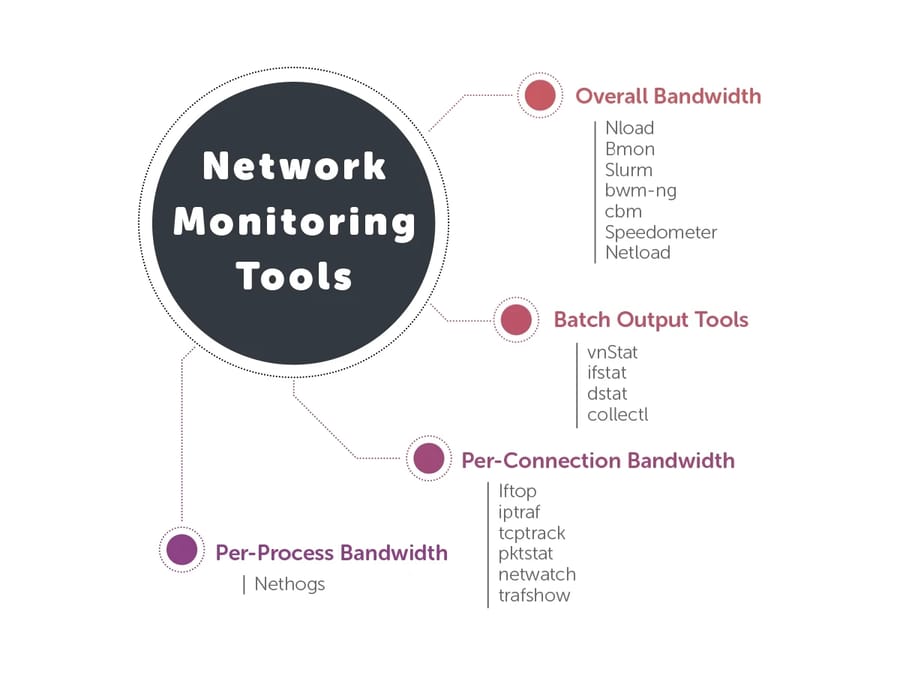
The below list is sorted as per their features:
- Based on the overall bandwidth of the network;
- Nload
- Bmon
- slurm
- bwm-ng
- cbm
- speedometer
- netload
- Based on the overall bandwidth (batch style output) of the network
- vnstat
- ifstat
- dstat
- collectl
- Based on the bandwidth per socket connection within the network;
- iftop;
- iptraf
- tcptrack
- pktstat
- netwatch
- trafshow
- Based on the bandwidth per process within the network
- nethogs
1. Based on Overall Bandwidth
1. Nload
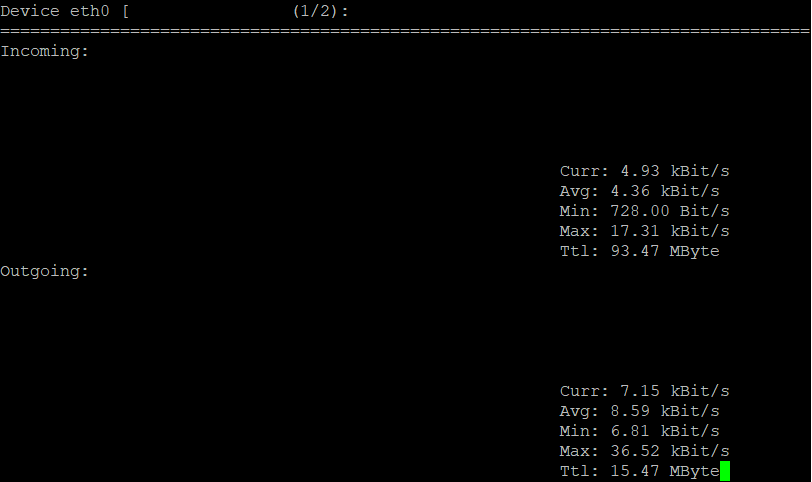
It is a command-line tool that helps you to monitor Linux incoming and outgoing traffic individually. It represents the traffic in a graphical form with an adjustable scale. This tool is straightforward to implement and analyze.
However, it does not come with multiple options. It displays the total bandwidth usage without going into the process level. In other tools, you can find the details of how much bandwidth each process consumes. However, for a general overlook of bandwidth, this tool is sufficient.
To install nload, use the following commands depending on your Linux distribution.
- To install on a Fedora or CentOS distribution.
$ yum install nload –ynload
- To install on Ubuntu/Debian distribution.
$ sudo apt-get install nloadnload
Note: Don’t forget to enter ‘nload’ after the installation is completed. By using the arrow keys, you can check between the network interfaces. To close the output, press ‘q’.
Output-
2. Bmon (Linux Bandwidth Monitor)
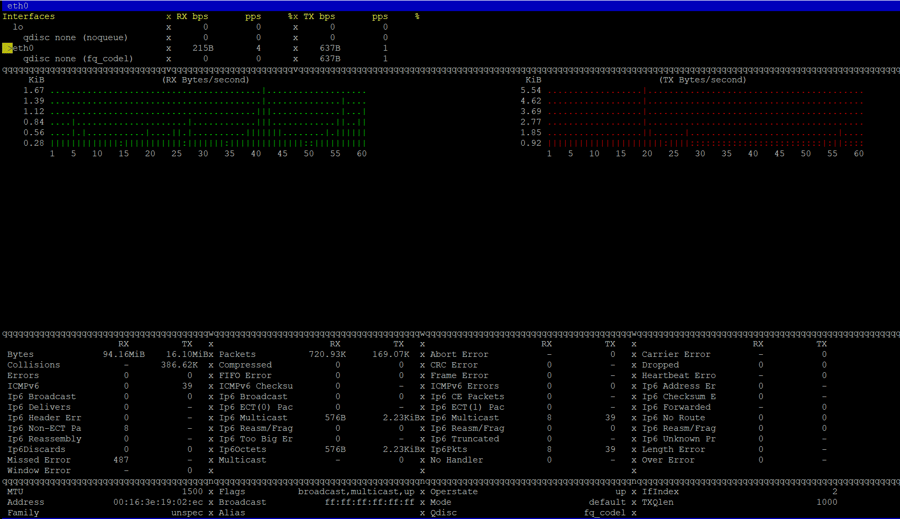
This tool works almost like the Nload tool that displays the traffic load within the system’s network interface. The output of the bmon shows the graph that comes with packet-level details of the traffic.
With the help of bmon, you can produce reports in HTML format. You can also refer to a man page for more details and bmon options.
Bmon command is available for distributions like Ubuntu, Debian, and Fedora from default repositories, while CentOS users will use repoforge as it is not available in the Epel repository.
- To install on Ubuntu or Debian distribution.
sudo apt-get install bmonbmon
- To install on Fedora or CentOS (from repoforge) distribution
sudo yum install bmonbmon
Output-
Note: You can check between the network interfaces by using the arrow keys. To close the output, press ‘q’. Press ’d’ to enable detailed statistics and press ‘i’ to allow additional information.
3. Slurm
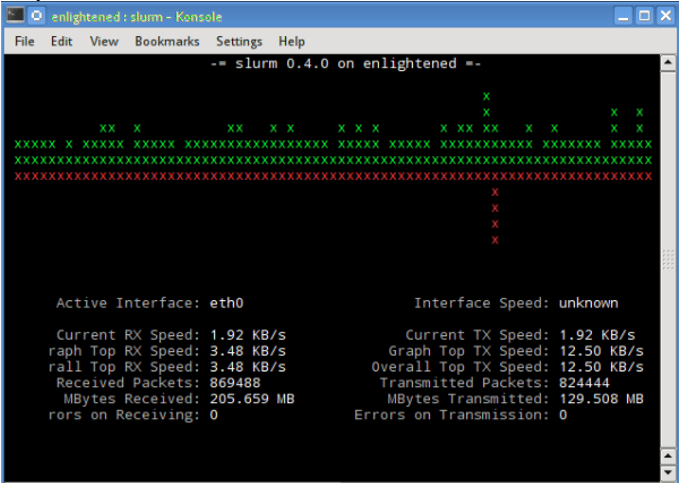
This is another tool for monitoring Linux network load by displaying the device statistics and the ASCII graph. This tool can generate three types of graphs that can be managed using different options with the slurm command.
- c - Classic mode showing one graph
- s - Split graph mode showing uploads and downloads. (default)
- l - Same as a split graph, but larger. Some text was omitted.
- L - TX/RX LED mode
- m - Cycle among classic (c), split (s), and large split (l)
- q - Quit
But it will not specify any other information to expect the network load. Install slurm tool with the help of the below commands:
- To install on Debian or Ubuntu distribution
sudo apt-get install slurm
- To install on a Fedora or CentOS distribution
sudo yum install slurm -yslurm -s -i eth0
Output-
4. Bwm-ng (Bandwidth Monitor Next Generation)
This Linux Bandwidth monitoring tool allows you to track real-time network loads. The report generated as the output of the command will display the summary of the speed at which the data flows in and out about all the available network interfaces present on the system.
Use the below listed Linux commands to install bwn-ng:
- To install on Ubuntu or Debian distribution
sudo apt-get install bwm-ngbwm-ng
- To install on Fedora or CentOS (from epel) distribution
sudo yum install bwm-ngbwm-ng
Output-;
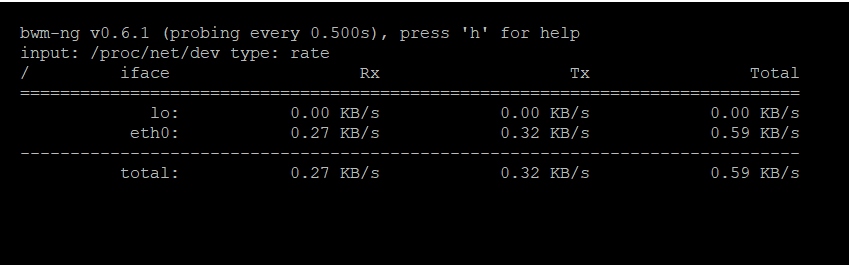
Note: After installation, don’t forget to run the program. To close the output, press ‘q’. Press ‘h’ to open help, showing all the key bindings used in bwm-ng.
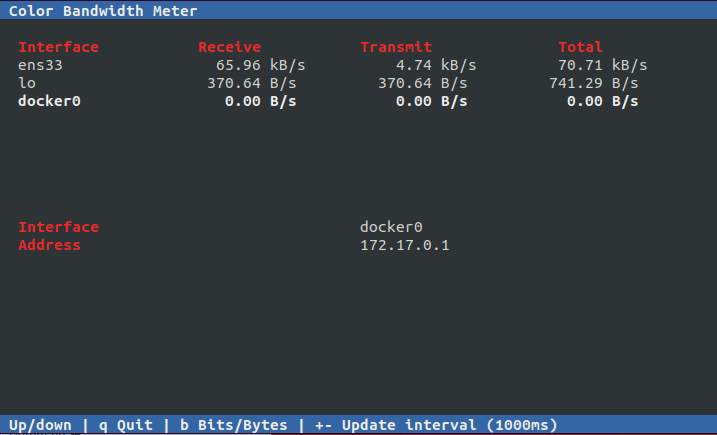
5. cbm (Color Bandwidth Meter)
This is the most straightforward command-line tool that displays the traffic volume through a user-friendly network interface within the system. It just shows the traffic stats, which get updated in real-time.
While cbm is running, you can control its behavior with the following keys:
- Up/Down – arrows keys to select an interface to show details.
- b – Switch between bits per second and bytes per second.
- + – increase the update delay by 100ms.
- -- – decrease the update delay by 100ms.
- q – exit from the program.
Use the below commands to install and run cbm:
- To install on Ubuntu or Debian distribution
sudo apt-get install cbmcbm
Output-;
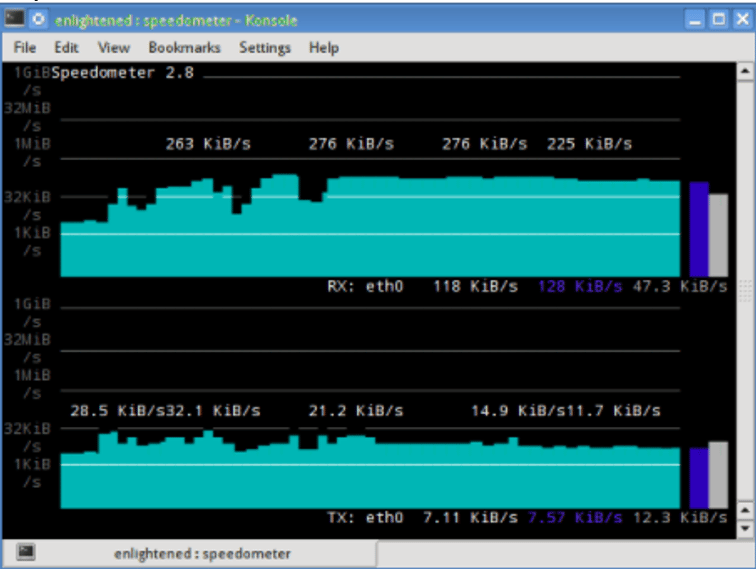
6. Speedometer
The speedometer displays a clean and clear graph displaying the Linux network traffic flowing in and out through all the system’s network interfaces.
- To install on Ubuntu or Debian distributions.
sudo apt-get install speedometerspeedometer -r eth0 -t eth0
Output -;
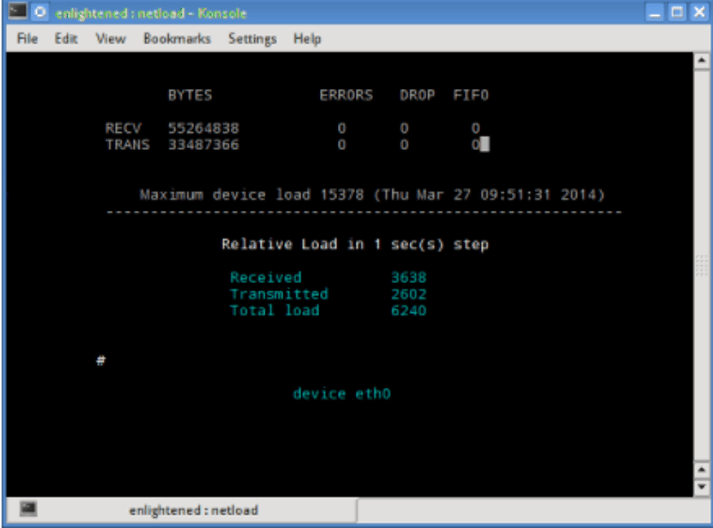
7. Netload
Netload displays a short report indicating the current Linux traffic load and the bytes being transferred after the process.
You can download Netload using the below command (Ubuntu or Debian)-
sudo apt-get install netdiagnetload eth0
Output -
2. Based on Overall Bandwidth (batch style output)
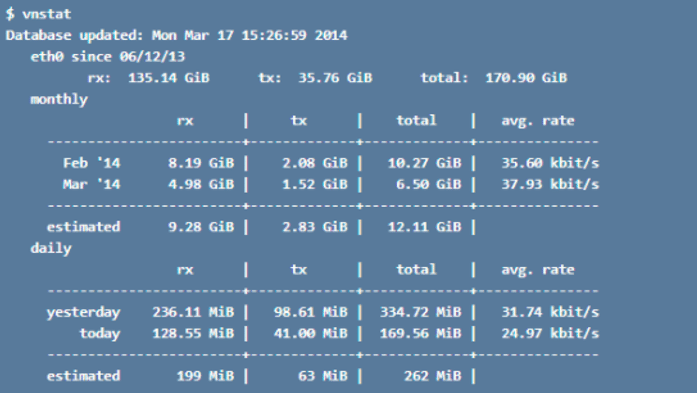
1. Vnstat
This tool is different from the other network monitoring tools as it runs a service/daemon in the background. This will record the data size that is being transferred all the time. Also, you can generate a report with a history of Linux network usage.
Install vnstat using the below commands.
- To install on Ubuntu or Debian distribution.
sudo apt-get install vnstat
- To install on Fedora or CentOS (from epel) distribution
sudo yum install vnstat
Check the vnstat running status using the below command.
service vnstat status
;* vnStat daemon is running
If you do not provide any option for running the vnstat command, it will display all the data transferred since the daemon’s start.
vnstat
Output -
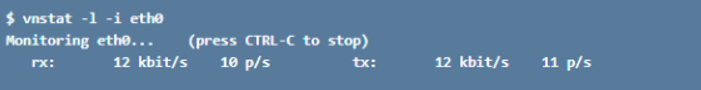
To display the real-time bandwidth usage, use the “-l” option with the vnstat command to display the total bandwidth used by the incoming and outgoing traffic without any additional information.
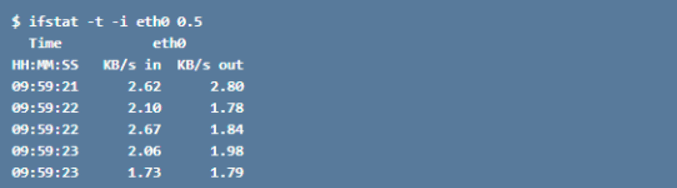
2. ifstat
It will provide the network bandwidth report in batch-style mode. The result is displayed in an easy format to understand and log.
Install the ifstat using the below commands.
- To install on Ubuntu, Debian distribution.
sudo apt-get install ifstat
- To install on Fedora, CentOS (Repoforge) distribution
sudo yum install ifstat
Output -
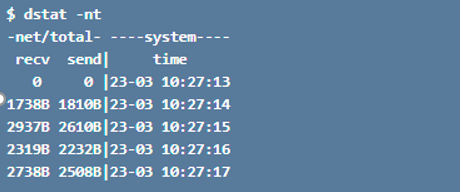
3. dstat
This tool is written in Python, allowing you to monitor different system stats and create a report in batch-style mode. It can also log the data to a CSV file format. Use the below command to install dstat on Ubuntu or Debian.
sudo apt-get install dstat
Output -
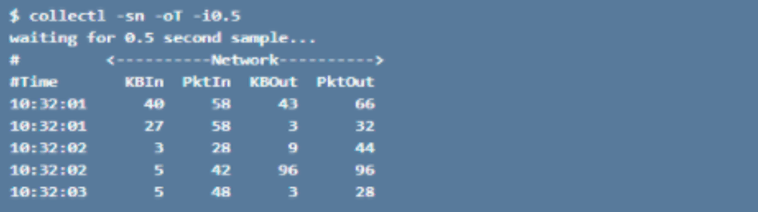
4. collectl
It also works the same as the dstat, which allows you to gather the system statistics regarding the different system resources it uses like CPU, memory, etc. You can use the below commands to install collectl.
- Ubuntu/Debian distributions
sudo apt-get install collectl
- Fedora distribution
sudo yum install collectl
Output -
3. Tools Based on Bandwidth Per Socket Connection
1. iftop
It allows you to measure the data flow through the socket connections. It works a bit differently from the nload. iftop comes with the pcap library that captures the packet movement to find the total used bandwidth and allows you to report an individual connection’s bandwidth without mentioning the process within that connection. iftop will enable you to filter the traffic usage within the selected connections.
Use the below commands to install.
- Fedora or CentOS distribution
yum install iftop –yiftop
- Ubuntu or Debian distribution
sudo apt-get install iftopsudo iftop -n
With n option will avoid creating additional network traffic.
Output -
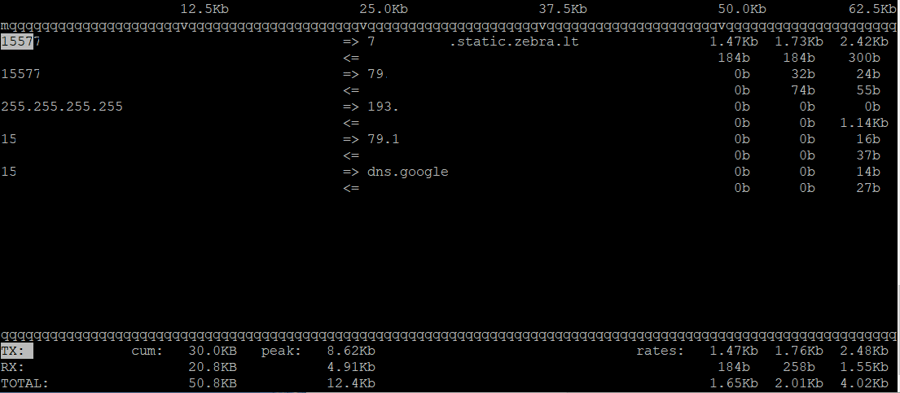
Note: The IP addresses are removed from the above picture due to security reasons. When you test it, you will see the complete IP address.
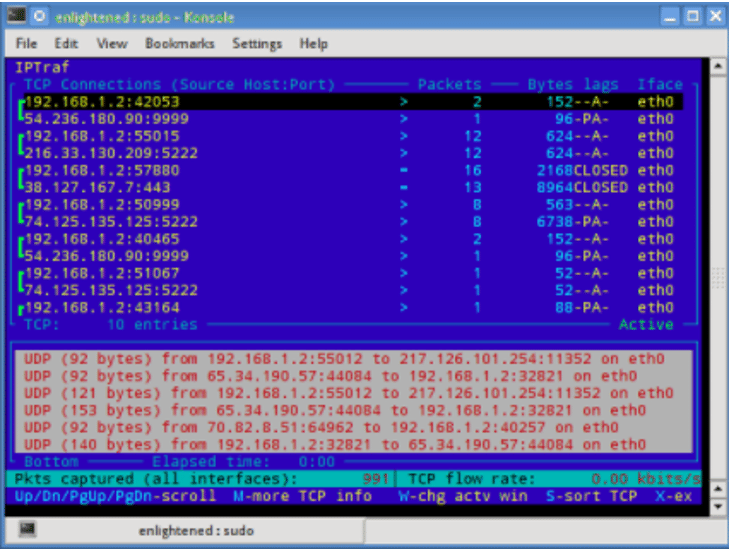
2. iptraf
It is an interactive IP LAN monitor displaying individual connections and the data transfer flow between the hosts. Use the below commands to install.
- To install on CentOS (base repo) distribution.
yum install iptraf
- To install on Fedora or CentOS (with epel) distribution
yum install iptraf-ng -y
- To install on Ubuntu or Debian distribution
sudo apt-get install iptraf iptraf-ngsudo iptraf
To start the IP traffic monitor for the eth0 interface, type the following command. Pass the -i all option for all interfaces:
iptraf-ng -i eth0;iptraf -i all
Output -
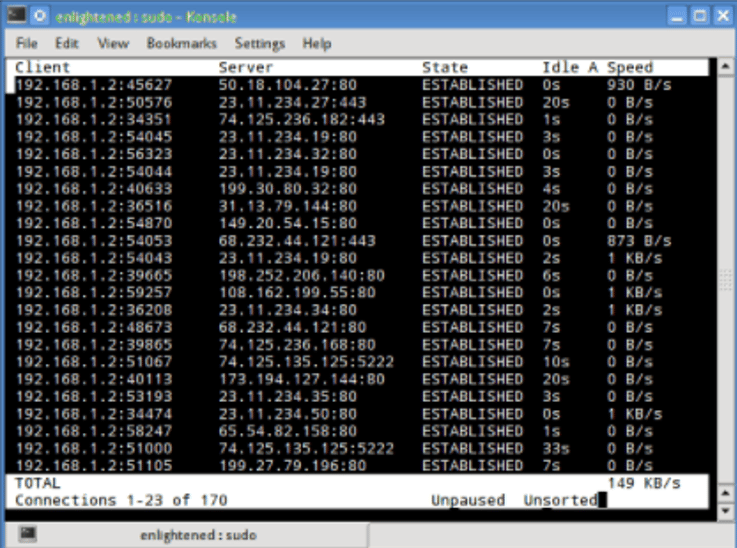
3. tcptrack
It is similar to the iftop, which provides a pcap library that captures the packet’s movement to find the total bandwidth used within each connection. To install, use the below commands accordingly.
- To install on Ubuntu, Debian distribution.
sudo apt-get install tcptrack
- To install on Fedora, CentOS (from repoforge repository) distribution
sudo yum install tcptrack
Output -
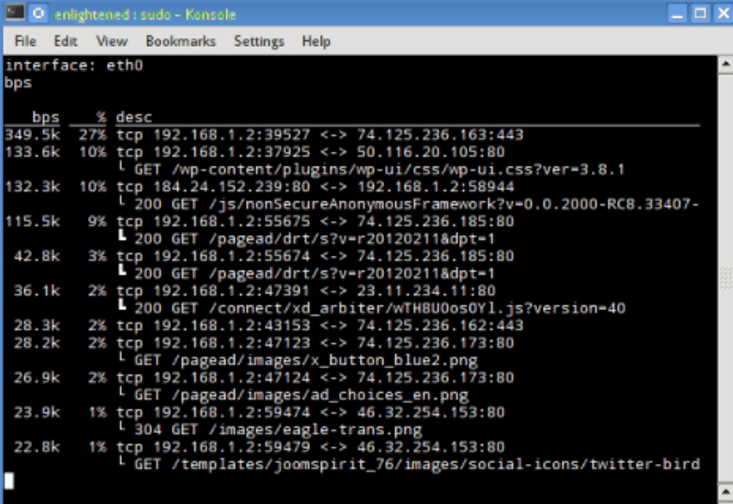
4. Pkstat
It displays the real-time and active connections and the speed with which the data flows. It specifies what type of connection is used for data transfer. Use the below commands to install on Ubuntu or Debian distros.
sudo apt-get install pktstatsudo pktstat -i eth0 -nt
Output -
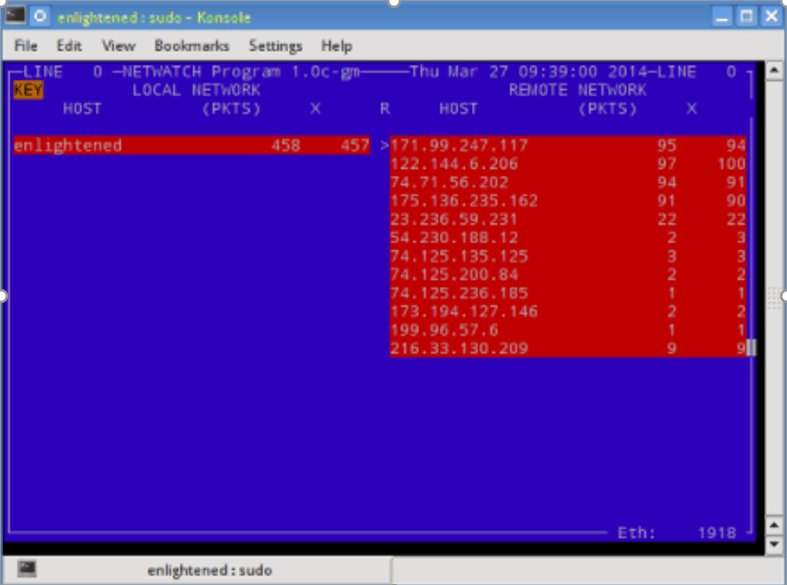
5. Netwatch
It comes as a part of the netdiag collection, which specifies the connection between the local host and the other remote hosts. It also specifies the speed with which the data is flowing between those connections.;
Install the tool using the below commands on Debian or Ubuntu.
sudo apt-get install netdiasudo netwatch -e eth0 -nt
Output -
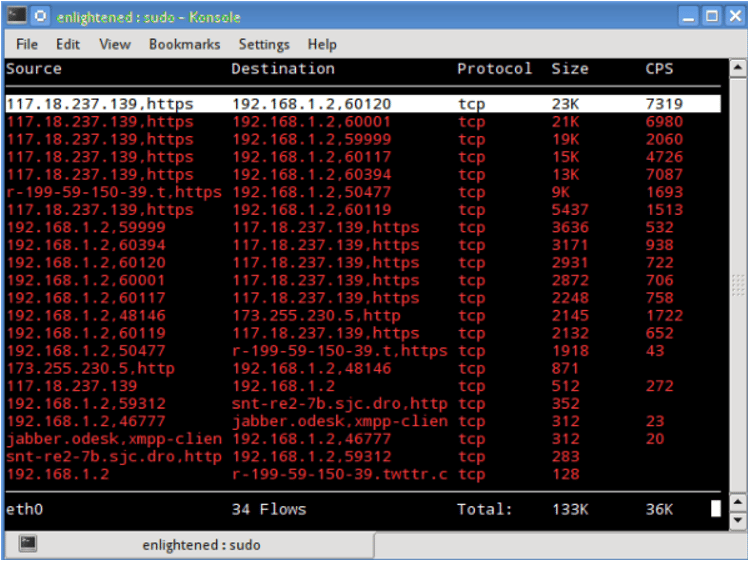
6. Trafshow
It works like netwatch and pkstat, which display the current connection’s transfer report. It allows you to monitor only TCP connections within the network. Install the tool using the below command (Debian or Ubuntu).
sudo apt-get install netdiagsudo trafshow -i eth0 tcp
Output -
4. Tools Based on Bandwidth Per Process
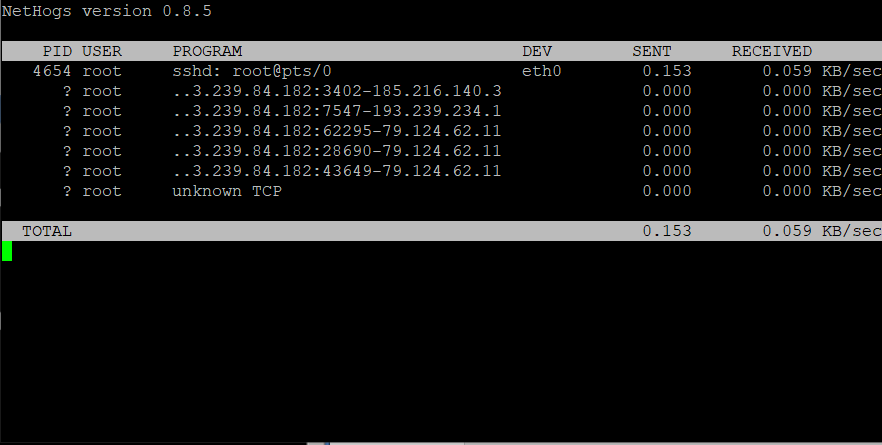
1. nethogs
It is a small net top tool that displays the bandwidth’s processes with the most intensive process on the top using the most bandwidth. Install the tool using the below command.
- To install on Ubuntu or Debian (default repos) distribution.
sudo apt-get install nethogs
- To install on Fedora or CentOS (from epel) distribution
sudo yum install nethogs -ysudo nethogs
Output -
Conclusion
|
Tool |
Interface Type |
Data Granularity |
Real-Time Monitoring |
Process-Level Insight |
Installation Command |
|
Nload |
CLI |
Overall Bandwidth |
Yes |
No |
|
|
Bmon |
CLI |
Interface Stats |
Yes |
No |
|
|
vnStat |
CLI |
Historical Data |
No |
No |
|
|
Iftop |
CLI |
Connection-Level |
Yes |
No |
|
|
Nethogs |
CLI |
Process-Level |
Yes |
Yes |
|
The commands mentioned above will allow you to get the traffic information in different ways, and you can use any of them which suits your purpose. You can run these commands on Linux; log in to the remote server over SSH. This is about how you can analyze and monitor the Linux networks or monitor the traffic.
For a Linux administrator, these are prevalent tools. If any of the commands do not work or you encounter an error, don’t hesitate to comment via the comment box listed below. Let us know your feedback and any other Linux network monitoring tools you use in the comments.
People are also reading:

Leave A Comment