
What is Linux monitoring and how does Linux system monitoring work?
Linux monitoring is the practice of tracking what's happening inside a server CPU, memory, disk, network, processes, logs, and service health — so you can catch problems before they take the system down. You do it with built-in commands like top, htop, df, and journalctl, or with dedicated tools such as Netdata, Prometheus + Grafana, Zabbix, and Nagios. The goal isn't fancy dashboards. It's knowing, at any moment, whether the box is healthy.
I've been running Linux servers for over a decade, and the single biggest mistake I see new admins make is treating monitoring as an afterthought. They install a VPS, deploy an app, and only check on it when something breaks. By then, the logs have rotated, the spike is gone, and you're guessing.
What Linux monitoring includes beyond CPU and RAM
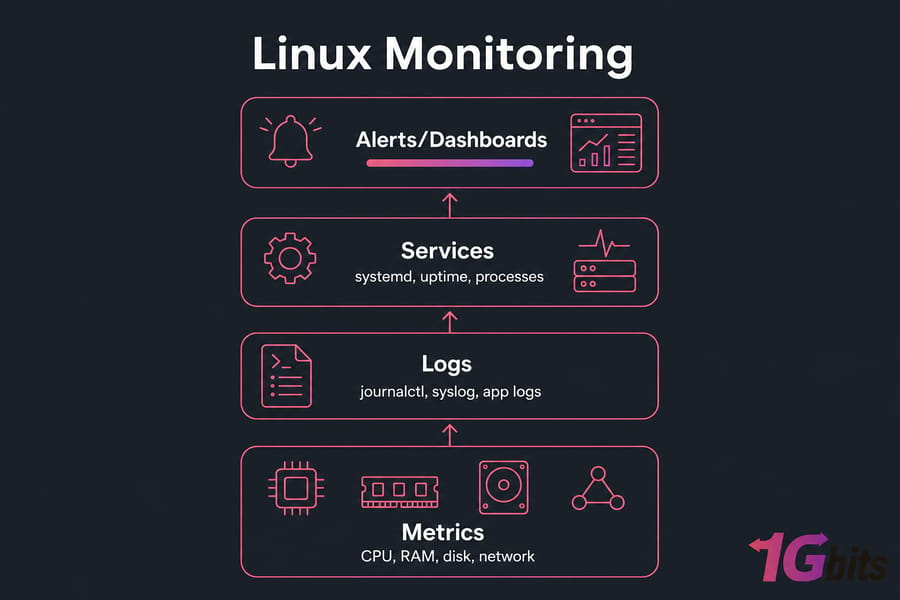
Most beginners think monitoring means "watching CPU." It doesn't. A proper setup tracks several distinct layers:
- System resources — CPU, memory, swap, disk space, disk I/O, network throughput
- Processes — what's running, what's eating resources, what's stuck
- Services — is nginx up? Did MariaDB crash overnight?
- Logs — syslog, journal, application logs, auth logs
- Uptime and availability — is the box reachable, are ports responding?
Miss any of these and you've got a blind spot. A server can look perfectly fine on a CPU graph while quietly running out of inodes or swapping itself to death.
Real-time monitoring vs historical monitoring vs alerting
These three things sound similar. They're not.
Real-time monitoring is what you do when you SSH in and run htop. You're looking at right now. Useful when you're already troubleshooting.
Historical monitoring stores metrics over time — hours, days, weeks. This is how you spot trends: "memory has been climbing 2% per day for three weeks." You need a tool for this. Commands alone won't cut it.
Alerting is what wakes you up at 3am when disk hits 95%. It's the part most people skip, then regret.
You need all three. Commands give you the live view. A tool like Netdata or Prometheus gives you history. And alerts make sure you don't have to stare at dashboards all day.
Linux monitoring for VPS, cloud, and dedicated servers
The principles are the same whether you're running a Linux VPS, a cloud instance, or a bare-metal box. What changes is scale and overhead. On a small 1-vCPU VPS, you can't afford to run a heavy agent that eats 200MB of RAM. On a dedicated server with 64 cores, you can run Prometheus, Grafana, an alertmanager, and barely notice.
If you're just getting started with Linux, our guide on how to use Linux covers the fundamentals before you dive into monitoring
Why Linux server monitoring matters for performance, uptime, and security
Here's the thing — monitoring isn't about being paranoid. It's about not being surprised.
How monitoring helps prevent downtime
Most outages don't happen out of nowhere. They build up. Disk fills slowly. A memory leak creeps. A connection pool gradually saturates. If you're collecting metrics and looking at trends, you see these coming days in advance. If you're not, you find out when your customers do.
I had a client once whose MySQL server kept crashing every 11 days, like clockwork. No alerts, no monitoring, just "the database is down again." Five minutes with journalctl and a quick look at memory trends showed a classic leak — the process kept growing until OOM-killer reaped it. We added a memory alert at 80%, restarted nightly as a band-aid, and patched the app. Problem solved. Without history, we'd still be guessing.
How monitoring speeds up troubleshooting
When a site gets slow, the first question is always: where's the bottleneck? CPU? Disk? Network? Database? Without monitoring, you're poking around with commands hoping to catch the issue while it's happening. With monitoring, you open a dashboard and the answer is right there.
This alone can cut your mean time to recovery (MTTR) by an order of magnitude. For more on diagnosing slow servers, check our guide on how to monitor and improve VPS server speed.
Why monitored servers are easier to scale
You can't capacity-plan what you don't measure. If you don't know your average CPU load, peak memory, or daily bandwidth, you have no idea whether you need a bigger plan or just better tuning. Monitoring gives you the data to make that call. It also feeds into Linux server security abnormal traffic spikes, failed login bursts, and unknown processes all show up in well-monitored systems first.
Key Takeaway: Linux monitoring isn't just CPU usage. Logs, disk I/O, network health, and service status matter just as much — and often more.
Linux performance monitoring metrics you should track first
If you're starting from zero, don't try to monitor everything. Start with the metrics that catch 90% of real-world problems.
CPU usage, load average, and process spikes
CPU usage is what percentage of the processor is busy. Load average is a different beast it measures how many processes are waiting to run. A load average of 4.0 on a 4-core box means everything is queued and waiting. On a 16-core box, it's basically idle.
Check both. High CPU with low load usually means one runaway process. High load with low CPU usually means I/O wait — disk or network is the real bottleneck.
Memory, cache, swap, and OOM risk
Linux uses free memory for cache aggressively, so "used memory" looks scary high but isn't. What you really care about is available memory (what apps can actually claim) and swap activity. If swap is being written to constantly, performance tanks. If memory pressure keeps climbing, OOM-killer will eventually murder your most important process. Usually at the worst possible time.
Disk usage, inode usage, and disk I/O latency
Three separate things, all of which can take you down:
- Disk space — the obvious one.
df -hshows it. - Inode usage — you can have plenty of space and zero inodes left if you've got millions of tiny files.
df -ireveals this. Mail servers and cache directories are common culprits. - Disk I/O latency — how long reads and writes take. This one's the silent killer. CPU and memory look fine but everything is slow because the disk can't keep up.
If you're not sure how your disk is performing, our Linux disk speed test guide walks through benchmarking.
Bandwidth, connections, packet loss, and network saturation
For network, watch bandwidth in/out, active connections, and dropped packets. A web server sitting at 95% of its NIC capacity will feel broken even though everything else looks healthy. Same for a server hitting connection limits. Our guide on how to monitor network traffic in Linux goes deeper.
Here's a priority table for what to monitor and why:
| Metric | Why It Matters | Warning Sign | Check With |
| CPU usage | Identifies runaway processes | Sustained >85% | top, htop, mpstat |
| Load average | Shows queued work, including I/O wait | Load > CPU core count | uptime, top |
| Available memory | True usable RAM after cache | <10% available | free -h, vmstat |
| Swap usage | Indicates memory pressure | Active swap-in/out | free -h, vmstat 1 |
| Disk space | Filesystem full = service crash | >85% on any mount | df -h |
| Inode usage | Filesystem can't create new files | >85% inodes used | df -i |
| Disk I/O wait | Silent performance killer | %iowait > 20% | iostat, top |
| Network throughput | NIC saturation = latency | Sustained near link cap | iftop, nload, ss |
| Packet drops | Network instability or overload | Non-zero, growing | ip -s link, netstat -s |
| Service status | App availability | Failed/inactive units | systemctl |
Pro Tip: A server can have 5% CPU usage and still feel sluggish. The culprit is almost always disk I/O wait, swap thrashing, or network saturation. Always check beyond CPU.
Linux monitoring commands for real-time server checks
Built-in commands are your first line of defense. They cost nothing, they're already installed, and they tell you exactly what's happening right now. Here's the toolkit every admin should know.
How to use top and htop for process monitoring
top is everywhere. Run it, you see CPU, memory, load average, and running processes sorted by resource use. Press P to sort by CPU, M by memory, 1 to see per-core stats.
htop is the friendlier cousin color-coded, scrollable, supports mouse, and lets you kill processes with F9. If it's not installed: apt install htop on Debian/Ubuntu or dnf install htop on AlmaLinux/Rocky. We've got a full htop installation guide if you need it. For deeper coverage of top's flags and quirks, see our Linux top command tutorial.
How to check memory with free and vmstat
free -h gives you a clean view of memory in human-readable units. Pay attention to the "available" column, not "free" — that's the number that matters.
vmstat 1 updates every second and shows memory, swap, I/O, and CPU together. The si and so columns (swap in/out) tell you if the system is paging. Non-zero values for more than a few seconds = trouble.
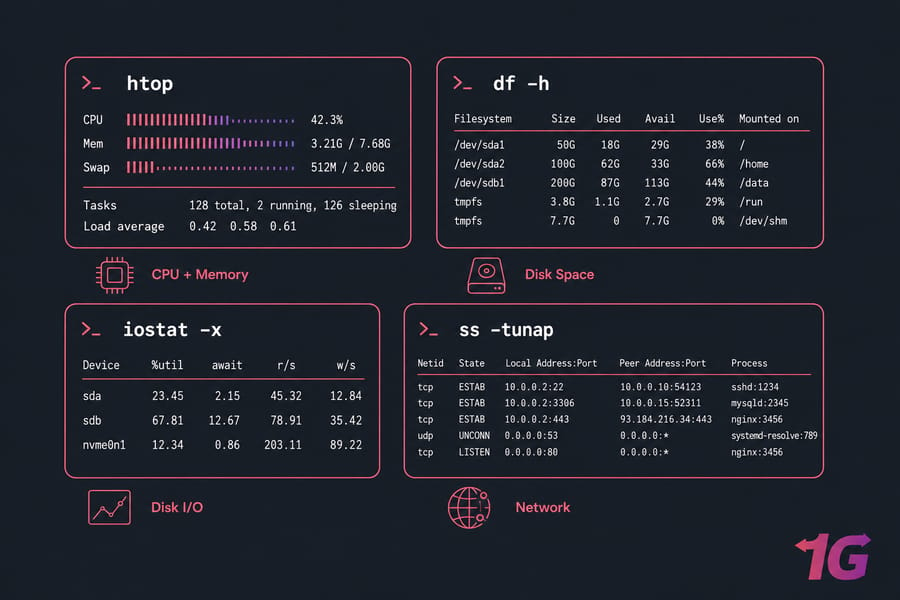
How to check storage with df, du, and iostat
df -h shows disk space per mounted filesystem. df -i shows inodes — don't forget this one. Full df command reference here.
du -sh /var/log tells you how much space a directory is using. Good for hunting down what's eating disk.
iostat -x 2 (from the sysstat package) is the disk I/O command. Watch %util and await. If %util stays above 80% and await is climbing, your disk is the bottleneck.
How to inspect sockets and traffic with ss and netstat
ss -tunap lists all TCP and UDP connections with process names. Faster and more modern than netstat, but netstat -tulpn still works fine if that's what your fingers know. Our guide on using netstat on Linux covers the syntax in detail.
For a quick "what's listening on this box?" — ss -tlnp does the job in one line.
How to inspect processes with ps and watch
ps aux shows every process with CPU and memory usage. Pipe it through grep or sort to find specifics. See our ps command and ps aux walkthroughs for more.
watch -n 2 'ps aux --sort=-%mem | head' refreshes the top memory hogs every two seconds. Indispensable. The watch command works with any command, not just ps.
Here's a quick reference for the commands every admin should know cold:
| Command | Use Case | Example | Best For |
top / htop |
Live processes & resources | htop |
Quick triage |
free |
Memory snapshot | free -h |
RAM & swap check |
vmstat |
System-wide stats over time | vmstat 1 |
Swap thrashing, I/O wait |
df |
Disk space per mount | df -h |
Quick disk check |
du |
Directory size | du -sh /var/* |
Finding space hogs |
iostat |
Disk I/O latency | iostat -x 2 |
Disk bottleneck check |
ss |
Sockets & connections | ss -tunap |
Network state |
ps |
Process inspection | ps aux |
Detailed process info |
journalctl |
systemd journal logs | journalctl -xe |
Recent service errors |
uptime |
Load avg & uptime | uptime |
Quick health glance |
sar |
Historical metrics | sar -u 1 5 |
Trends from past hours/days |
dstat |
Combined live stats | dstat -cdngy |
Multi-metric one-liner |
Warning: Built-in commands are perfect for live checks. They don't replace historical trending or alerting. You need a tool for that.
Best Linux monitoring tools compared for dashboards and alerts
Commands tell you what's happening now. Tools tell you what's been happening, what's about to happen, and notify you when something breaks. There are dozens of options out there, but five or six actually matter for most server admins.
Lightweight Linux monitoring tools for a single VPS
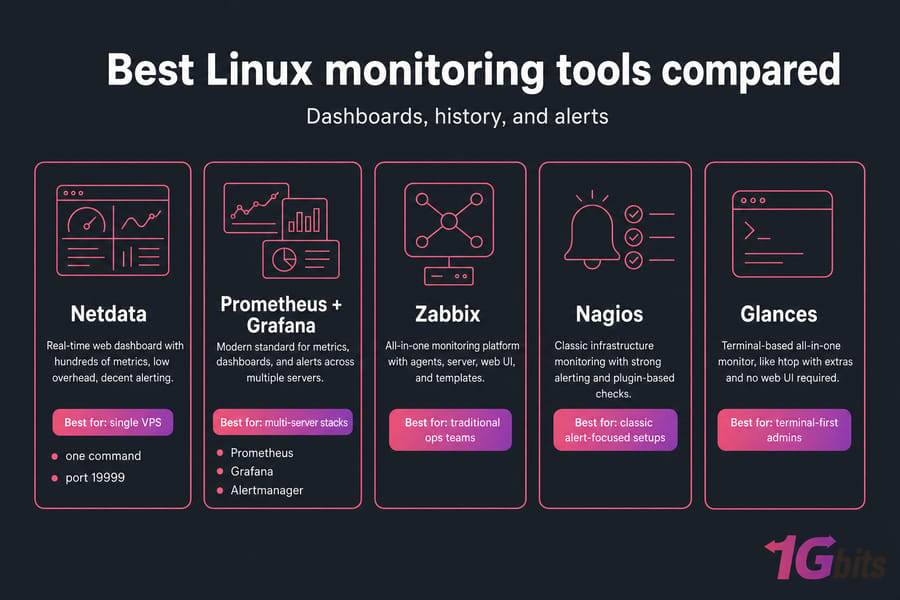
Netdata is my default recommendation for a single VPS. Install it with one command, open port 19999, and you get a real-time dashboard with hundreds of metrics out of the box. CPU, memory, disk, network, MySQL, nginx, Docker — it auto-detects most things. Low overhead, beautiful interface, decent alerting.
Glances is a terminal-based all-in-one. Think of it as htop with extras — disk I/O, network, sensors, Docker, all in one screen. No install hassle, no web UI required.
nmon is another classic terminal tool, especially popular for capturing snapshots you can review later.
Full Linux monitoring stacks for multiple servers
Prometheus + Grafana is the modern standard. Prometheus scrapes metrics from agents (node_exporter for system metrics, plus exporters for nginx, MySQL, Redis, you name it). Grafana visualizes them. Alertmanager handles notifications. It's powerful, flexible, and the entire cloud-native world runs on it. Steeper learning curve, but worth it once you're managing more than two or three servers.
Zabbix takes a more "all-in-one" approach. Agents, server, web UI, and alerting all from one project. Better for traditional ops teams that want a single platform with strong out-of-the-box templates. Heavier than Netdata, easier to operate than Prometheus.
Nagios is the old guard. It's check-based rather than metric-based — it asks "is this service up? is this disk under 90%?" and alerts on yes/no answers. Still solid for uptime and service monitoring, less great for metric trends.
Prometheus vs Zabbix vs Nagios vs Netdata
| Tool | Best For | Setup | Dashboards | Alerting | Overhead |
| Netdata | Single VPS, real-time | Very easy | Excellent built-in | Good | Low |
| Prometheus + Grafana | Multi-server, cloud-native | Moderate | Excellent (Grafana) | Excellent | Medium |
| Zabbix | Mixed infra, traditional ops | Moderate | Good | Excellent | Medium-High |
| Nagios | Service/uptime checks | Moderate-Hard | Basic | Strong | Low-Medium |
| Glances | Terminal-only live view | Very easy | Terminal-based | Basic | Very low |
| nmon | Snapshots & capture | Very easy | Terminal-based | None | Very low |
Open source vs hosted monitoring platforms
Hosted platforms like Datadog, New Relic, or Grafana Cloud handle storage, dashboards, and alerts for you. You install an agent, point it at their endpoint, done. The trade-off is cost — they get expensive fast as servers and metrics grow — and data privacy, since metrics leave your infrastructure.
For most 1Gbits customers running one to twenty servers, self-hosted is the better fit. Netdata for simple, Prometheus + Grafana for serious. If you're managing 100+ servers and have a budget, hosted starts to make sense.
For log aggregation specifically, take a look at our Graylog setup guide — it pairs nicely with metric monitoring.
Quick Summary: Netdata for fast visibility on one box. Prometheus + Grafana or Zabbix for scale and history. Nagios when uptime checks are the priority.
Linux log monitoring, service monitoring, and uptime checks
Metrics tell you what went wrong. Logs tell you why. You need both.
How to monitor logs with journalctl and syslog
On modern systemd-based distros (Ubuntu, Debian, AlmaLinux, Rocky, basically everything current), journalctl is your main log tool. A few essentials:
journalctl -xe— recent errors with explanationsjournalctl -u nginx -f— follow logs for a specific servicejournalctl --since "1 hour ago"— time-bounded queriesjournalctl -p err -b— error-level messages since last boot
Traditional log files still live in /var/log/. /var/log/syslog (Debian/Ubuntu) or /var/log/messages (RHEL family) hold general system logs. /var/log/auth.log or /var/log/secure hold authentication events — watch these for brute-force attempts. Our Linux logs guide covers all the common paths.
For app-specific issues, check the app's own logs. Apache errors live in places like /var/log/apache2/error.log — see our Apache error log guide.
How to monitor systemd services with systemctl
Three commands cover 90% of what you'll need:
systemctl status nginx— current state, recent log lines, PIDsystemctl list-units --failed— every failed service on the boxsystemctl is-active mysql— quick scripted check, returns "active" or otherwise
For a broader look at what's running, see how to list running services in Linux.
How to check uptime, reboots, and recurring failures
uptime shows how long the box has been running and the load average. last reboot lists all reboots — useful for spotting unexpected restarts. journalctl --list-boots does the same with timestamps.
Things worth alerting on: repeated service crashes (more than twice in 24h), authentication failure bursts, disk-full events, OOM-killer activity, and any "I/O error" or "filesystem read-only" messages. Those last two mean something's deeply wrong — often a failing disk.
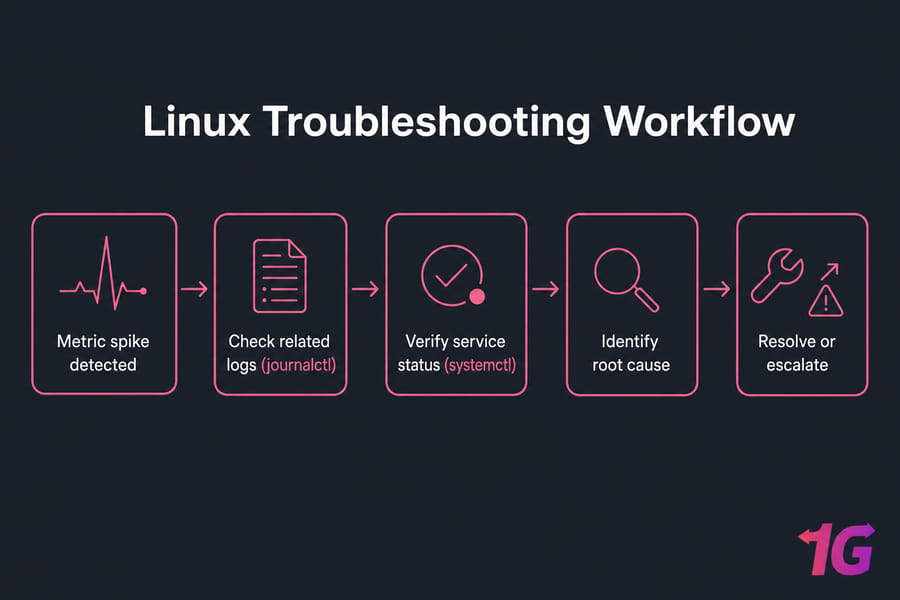
How to monitor a Linux server step by step
Enough theory. Here's the workflow I actually use when bringing a new server under monitoring.
Step 1: Define your critical services and thresholds
Before you install anything, write down what matters on this server. Is it a web server? Then nginx/apache being up, response times, and 5xx rates are critical. Database server? MySQL connection count, query latency, replication lag. A trading VPS? Network latency above all else.
Decide what "bad" looks like. Disk above 85%? Load above 2x core count for five minutes? Service down for more than 60 seconds? Write these down. You'll turn them into alerts later.
Step 2: Start with built-in Linux monitoring commands
SSH in and run through the basics. htop for a live view, free -h for memory, df -h and df -i for disk, iostat -x 2 for disk I/O, ss -s for socket summary, journalctl -p err -b for recent errors. This is your baseline. Note what "normal" looks like for this box.
Step 3: Add dashboards and alerts
Now install a tool. For a single server, I'd grab Netdata:
bash <(curl -Ss https://my-netdata.io/kickstart.sh)Open the dashboard, configure alert destinations (email, Slack, Discord, Telegram — Netdata supports them all), and you're done. Total time: under 30 minutes.
For multiple servers, install node_exporter on each, point a central Prometheus at them, and connect Grafana for visualization. Use a community dashboard like "Node Exporter Full" to start — don't build from scratch.
Step 4: Review trends and tune thresholds
Give it a week. Look at the graphs. You'll find:
- Daily peaks you didn't know about
- Memory creeping up overnight from a leak
- Cron jobs spiking disk I/O at 4am
- Backups eating bandwidth at the worst time
Tune your alert thresholds based on real data, not guesses. If your "normal" CPU peak is 70%, don't alert at 60%. You'll go insane.
Pro Tip: Set baselines before alerts. Without knowing what's normal, every threshold is a guess — and noisy alerts get ignored.
Need a Linux server you can actually monitor and scale?
If your current server is underpowered or unstable, monitoring alone won't fix the root problem. 1Gbits offers high-performance Linux VPS hosting with full root access, flexible resources, and global locations. For teams that want monitoring and maintenance handled, our managed VPS plans include proactive server health oversight.
Common Linux monitoring mistakes that hide real server issues
I've seen the same mistakes in dozens of environments. Here are the big ones, and what to do instead.
| Mistake | Why It Hurts | Better Approach |
| Watching only CPU | Misses disk I/O, swap, network bottlenecks | Monitor all four resource layers |
| No baselines | Every threshold is a guess | Run for a week before setting alerts |
| Noisy alerts | Real incidents get ignored | Only alert on actionable conditions |
| No log correlation | You see the symptom, not the cause | Tie metrics to logs in your workflow |
| No retention | Can't spot weekly or monthly trends | Keep at least 30 days of metric history |
| Heavy tools on small VPS | Monitoring eats the resources you're watching | Match tool weight to server size |
| Ignoring inodes | Filesystem fills despite free space | Alert on df -i too, not just df -h |
| No on-call playbook | Alerts fire but nobody knows what to do | Document response for each alert type |
The alert fatigue one is worth emphasizing. I've walked into shops where the team gets 200 alerts a day and ignores all of them. The first time a real issue fires, nobody notices for hours. If your alert can't be acted on, it shouldn't exist. For more on the underlying issues that cause performance problems, see our guides on common VPS performance bottlenecks and optimizing your VPS for maximum performance.
Warning: Alert fatigue is real. Teams that get flooded with alerts stop reading them — and miss the one that actually matters.
Which Linux monitoring setup is best for your environment?
One size doesn't fit all. Here's my honest recommendation by server type.
| Environment | Recommended Setup | Why | Complexity |
| Small VPS (1-2 cores) | Built-in commands + Netdata or Glances | Low overhead, instant visibility | Low |
| Web/app server | Netdata or Prometheus + Grafana + app exporters | App-level metrics matter as much as system | Medium |
| Database server | Prometheus + Grafana + DB exporter, alerts on slow queries | Query latency and replication need history | Medium |
| Multi-server fleet | Centralized Prometheus + Grafana + Alertmanager, or Zabbix | Single pane of glass, scalable retention | High |
| Managed hosting customer | Host-provided infrastructure monitoring + app-level checks | Provider handles system, you handle app | Low |
Best setup for a small Linux VPS
Netdata, and that's it. Maybe add a free uptime checker like UptimeRobot for external availability. Don't overthink it. A 1GB VPS doesn't need Prometheus.
Best setup for web hosting and application servers
Prometheus + Grafana with node_exporter and a relevant app exporter (nginx, php-fpm, MySQL). Set up Alertmanager and route notifications to your phone or chat platform. For larger deployments, a Linux dedicated server gives you the headroom to run the monitoring stack alongside your workload without contention.
Best setup for growing infrastructure and dedicated servers
Centralized stack — Prometheus federation or a single Prometheus per environment, Grafana for dashboards, Alertmanager for routing, plus log aggregation (Loki or Graylog). Retain metrics for 90+ days so you can answer "what changed last month?" Add synthetic uptime checks from external locations. This is the setup for serious production.
Build a faster, easier-to-manage Linux environment
Good monitoring starts with good infrastructure. Whether you're running a small VPS, a production application, or a multi-server stack, the right hosting makes monitoring simpler and troubleshooting faster. 1Gbits offers Linux VPS, managed VPS, and Linux dedicated servers built for performance, uptime, and full control — with 24/7 support, global locations, and root access on every plan.
Pick the right size, install your monitoring of choice, and you'll spend a lot less time wondering what your server is doing — and a lot more time building.

Leave A Comment