
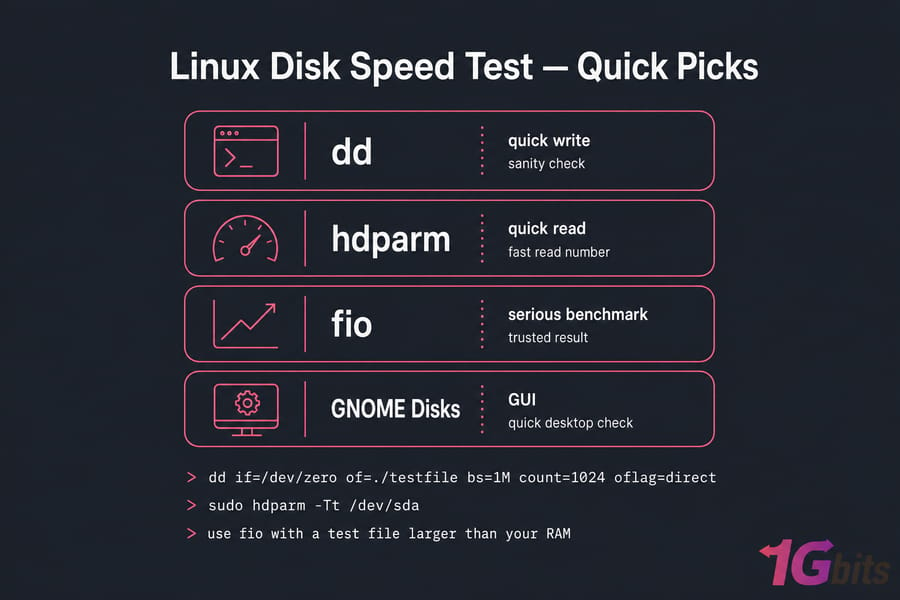
Need the fastest path to a number? Here it is:
- Quick write test:
dd if=/dev/zero of=./testfile bs=1M count=1024 oflag=direct - Quick read test:
sudo hdparm -Tt /dev/sda - Serious benchmark: use
fiowith a test file larger than your RAM
Use dd for a sanity check, hdparm when you want a fast read number, and fio when you actually care about the result. That last one is the only tool to trust on a production-grade Linux VPS hosting box. Whether you're a system administrator, a power user, or someone hosting a Linux VPS, disk speed directly affects your application's performance, boot time, and data transfer efficiency.
Why Run a Linux Disk Speed Test?
Disks are often the silent bottleneck. CPU and RAM get the spotlight, but a slow disk drags everything down — boot times, database queries, container builds, even SSH responsiveness if I/O wait pegs the kernel. Running a disk speed test in Linux helps you understand:
- How fast your storage device reads and writes data
- Whether your disk is underperforming
- If your SSD/HDD is suitable for workloads like gaming, databases, or media rendering
- Whether your disk is becoming a bottleneck in server environments
I run a benchmark in three situations: when a server feels sluggish for no obvious reason, when comparing two hosting plans before I migrate, and after any storage change (new SSD, RAID rebuild, kernel upgrade). The numbers don't lie. Vibes do.
Before You Benchmark: Don't Skip This
This is the part most tutorials gloss over, and it's where people get into trouble. A bad benchmark is worse than no benchmark — you'll act on numbers that don't reflect reality.
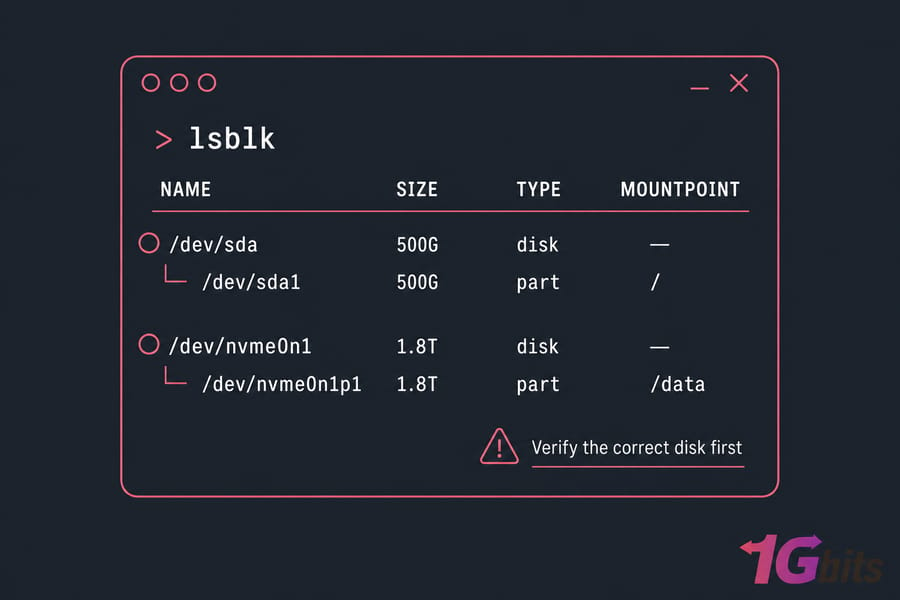
Find the correct disk first
Running a write test against the wrong device can wipe data. Always confirm what you're touching:
lsblk
df -h
sudo fdisk -l
lsblk shows the tree of block devices and mount points. df -h tells you which filesystem is mounted where. If /dev/sda is your boot disk and /dev/nvme0n1 is the data volume, you want to be very sure which one your command is hitting.
Don't benchmark production disks during peak hours
Synthetic load on a live server can spike latency for real users. If you must test in production, do it on a dedicated test file inside a filesystem you control — never against a raw block device that holds live data.
Beat the cache
Linux loves to cache. If your test file fits in RAM, you're benchmarking memory, not disk. Two rules:
- Make the test file at least 2× your system RAM
- Use
oflag=directwithddor--direct=1withfioto bypass the page cache
You can also drop caches between runs with sync; echo 3 | sudo tee /proc/sys/vm/drop_caches. Run any benchmark three times and average the results. One run is noise.
What Actually Matters: Throughput, IOPS, Latency
Three numbers tell the story. Most tutorials only show one.
| Metric | What it measures | Matters most for |
| Throughput (MB/s) | Bulk data movement | Video, backups, large file transfers |
| IOPS | Small operations per second | Databases, VMs, web apps |
| Latency (ms or µs) | Time per operation | Real-time apps, interactive workloads |
An NVMe drive that pushes 5 GB/s sequential can still feel slow if its random 4K latency is poor. That's why a single MB/s number is misleading. Databases live and die on IOPS and latency, not throughput.
Command Line Tools That Actually Work
dd — the quick-and-dirty write test
dd is a versatile Unix command that can quickly test write performance by writing a dummy file:
dd if=/dev/zero of=./testfile bs=1M count=2048 oflag=direct
rm ./testfile
This writes 2 GB of zeros and reports MB/s. The oflag=direct bit skips the page cache. Explanation of flags:
if=/dev/zero: generates zero-filled blocksof=testfile: target file to write tobs=1M count=2048: writes 2048 blocks of 1 MB each (2 GB total)oflag=direct: bypasses the page cache for more accurate measurements
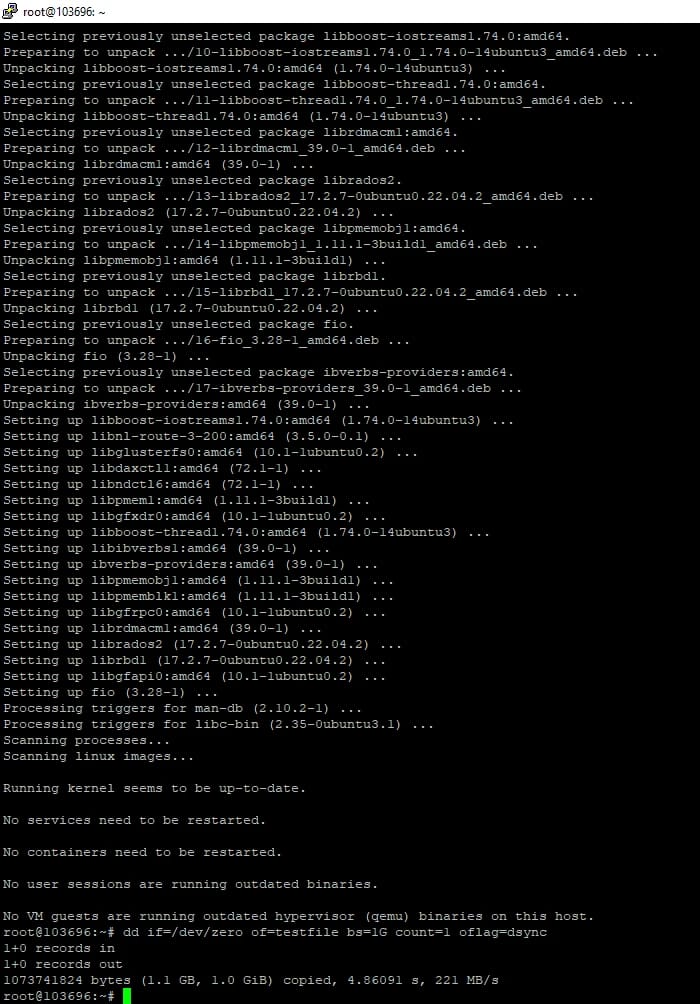
💡 Ideal for testing sequential write speeds. Limitations? It only measures sequential write with a single thread. Don't quote dd numbers in a capacity-planning meeting.
hdparm — fast read check
This is one of the most common and accurate methods for checking disk read performance:
sudo hdparm -Tt /dev/sda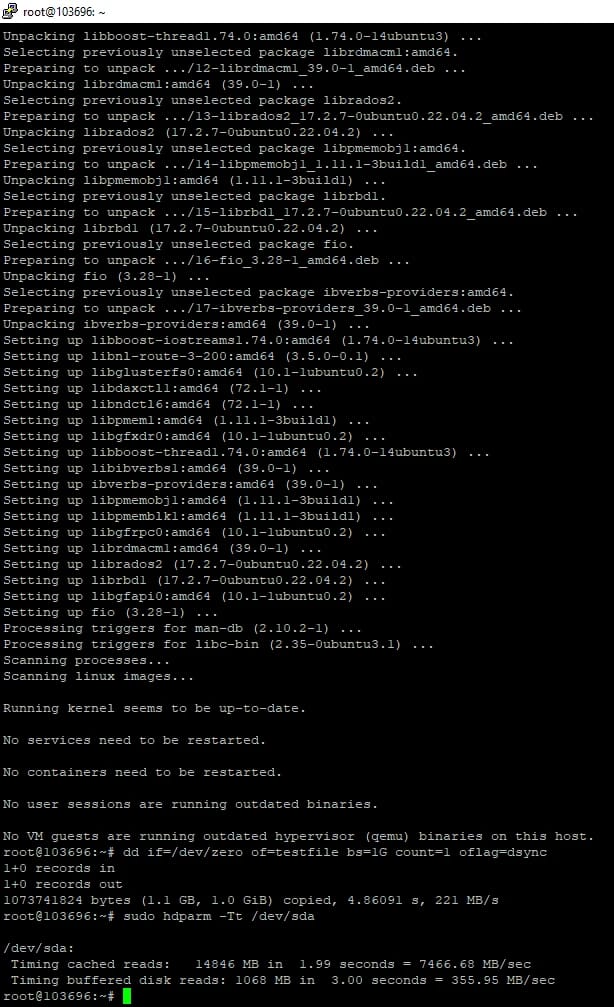
- Buffered Disk Reads (-t): Direct read from disk to RAM — this is what you want
- Cached Reads (-T): Read from the buffer cache (RAM) — basically memory speed, ignore it
📊 Output includes MB/s speeds, useful for quick comparisons between drives. hdparm is showing its age on NVMe though; treat it as a rough indicator, not a verdict.
fio — the real benchmark
fio is an industry-standard disk benchmark utility that simulates real-world workloads. It's especially useful for developers and system administrators. If you only learn one tool, learn fio. Install it:
# Ubuntu / Debian
sudo apt install fio

# Arch Linux
sudo pacman -S fio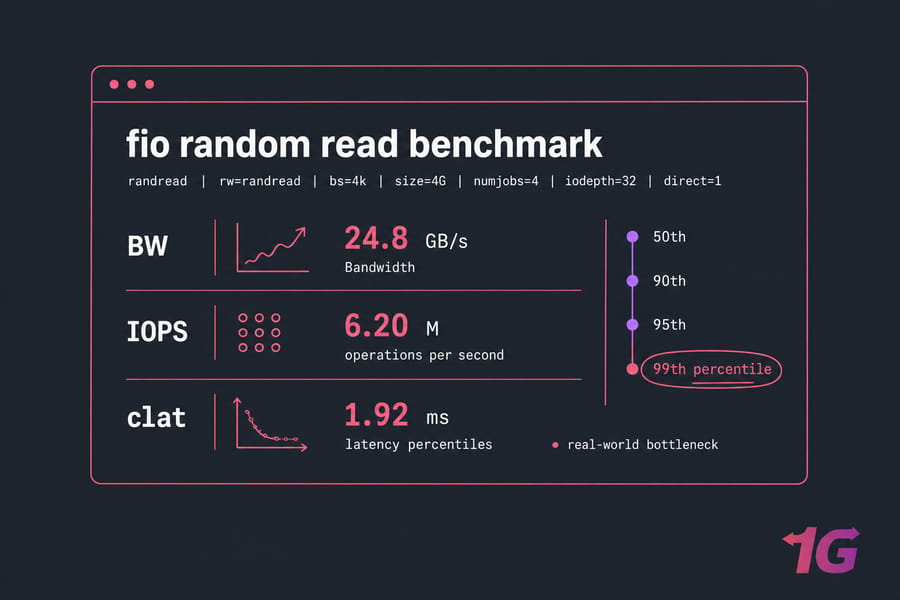
fio Benchmark Examples
Sequential read — large file transfers, media streaming:
fio --name=seqread --rw=read --bs=1M --size=4G --numjobs=1 \
  --iodepth=16 --ioengine=libaio --direct=1 --runtime=30 --group_reporting
Sequential write — backups, bulk loads:
fio --name=seqwrite --rw=write --bs=1M --size=4G --numjobs=1 \
  --iodepth=16 --ioengine=libaio --direct=1 --runtime=30 --group_reporting
Random read (4K) — databases, web apps:
fio --name=randread --rw=randread --bs=4k --size=4G --numjobs=4 \
  --iodepth=32 --ioengine=libaio --direct=1 --runtime=30 --group_reporting
Random write (4K) — transactional workloads:
fio --name=randwrite --rw=randwrite --bs=4k --size=4G --numjobs=4 \
  --iodepth=32 --ioengine=libaio --direct=1 --runtime=30 --group_reporting
Mixed 70/30 — realistic server load:
fio --name=mixed --rw=randrw --rwmixread=70 --bs=4k --size=4G \
  --numjobs=4 --iodepth=32 --ioengine=libaio --direct=1 --runtime=60 --group_reporting
In the output, look at three lines: BW (bandwidth), IOPS, and the clat (completion latency) percentiles. The 99th-percentile latency is usually what kills real-world performance.
GUI Tools for When You Don't Want a Terminal
Not everyone loves the terminal. If you prefer graphical tools for your Linux disk speed test, here are some options:
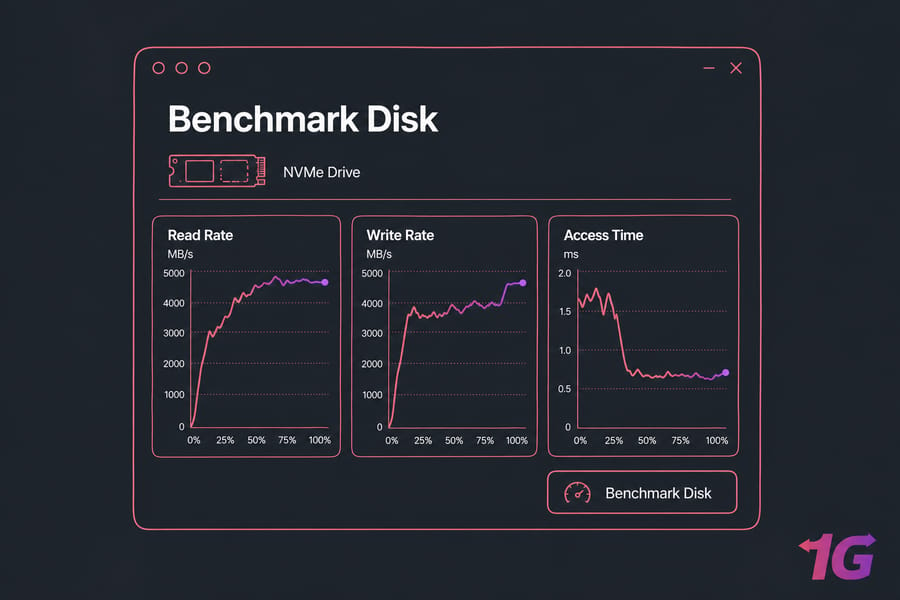
GNOME Disks
GNOME Disks ships with most desktop distros. Most GNOME-based Linux distros have the "Disks" utility built-in:
- Open the app
- Select a disk
- Click the menu and choose "Benchmark Disk"
- Press "Start Benchmark"
It shows both read/write performance and access time, great for basic users and sysadmins alike. Fine for laptops and quick checks.
KDiskMark
Inspired by Windows's CrystalDiskMark, KDiskMark offers a GUI for Linux disk speed testing. It's actually a friendly wrapper around fio, so the numbers are trustworthy. It's available in most major repositories. To install on Ubuntu:
sudo add-apt-repository ppa:jonmagon/kdiskmark
sudo apt update
sudo apt install kdiskmark
KDiskMark allows sequential/random read-write tests with graphical charts.
Expected Speeds by Drive Type
Rough ranges — controller, firmware, and PCIe generation all swing these numbers:
| Drive type | Sequential read/write | Random 4K IOPS |
| HDD (7200 RPM) | 80–200 MB/s | 75–200 |
| SATA SSD | 400–550 MB/s | 20,000–90,000 |
| NVMe (Gen3) | 1.5–3.5 GB/s | 200,000–500,000 |
| NVMe (Gen4/5) | 5–14 GB/s | 500,000–1.5M+ |
If your SATA SSD is benchmarking at 150 MB/s, something's wrong — bad cable, SATA II port, or a failing drive. Run smartctl.
Reading Your Results Without Fooling Yourself
A few honest truths learned the hard way:
- A great
ddnumber doesn't mean your database will be fast.ddtests one thread, sequential, large blocks. Databases do the opposite. - If
hdparm -Tshows 10 GB/s, you're reading cache. Ignore it. - Cloud disks have burst credits. Your first 30 seconds look great, then performance collapses to the baseline. Run a 5-minute test before you trust the number.
- Run every benchmark at least three times and discard the first run.
Disk Speed on a VPS or Cloud Server
VPS storage is weird. You might be on local NVMe one minute and network-attached storage the next, depending on the provider. Noisy neighbors on shared hosts can swing your IOPS by 50% between runs. That's not your benchmark lying — it's the underlying reality. In high-demand environments like cloud servers or Linux VPS Hosting, disk speed becomes even more critical. Use fio or ioping to evaluate:
- IOPS (Input/output operations per second)
- Latency
- Throughput
Example ioping command:
sudo ioping -c 10 /mnt/dataFor database-heavy workloads, IOPS matters more than throughput. If you're seeing high I/O wait on top or iostat, and random 4K IOPS are below ~10,000, your storage tier is the bottleneck. That's usually the moment to look at NVMe-backed Linux VPS hosting rather than older SATA SSD plans.
Troubleshooting Slow Disk Performance
Numbers came in low? Work through this list before blaming the hardware:
- SMART health:
sudo smartctl -a /dev/sda— check reallocated sectors, pending sectors, and wear leveling. - Live I/O:
iostat -xz 2shows per-device utilization and await time. High%utilwith low throughput means contention. - Latency probe:
ioping -c 10 /mnt/datagives you a quick latency reading. - Free space: SSDs slow down dramatically above 85% full. Check
df -h. - Thermal throttling: NVMe drives without heatsinks throttle hard under sustained load. Check
nvme smart-log /dev/nvme0. - Background jobs: RAID rebuilds, backups, and cron jobs can eat all your I/O. Check
iotop.
Real-World Use Cases for Disk Speed Testing
- Web Hosting: Evaluate disk speed for better CMS performance
- Game Servers: Low latency read/write is key
- Database Hosting: High IOPS is critical for fast queries
- Rendering & Media: Need fast throughput for large files
Need even faster performance? Learn how to push CPU performance too with our CPU Benchmark Software guide.
Tool Comparison Cheat Sheet
| Tool | Best for | Measures | Interface |
| dd | Quick write sanity check | Sequential write MB/s | CLI |
| hdparm | Quick read check | Sequential read MB/s | CLI |
| fio | Serious benchmarking | Throughput, IOPS, latency | CLI |
| GNOME Disks | Desktop / casual | Read, write, access time | GUI |
| KDiskMark | Visual fio frontend | Same as fio | GUI |
Conclusion
Whether you're trying to test disk speed for troubleshooting, benchmarking, or upgrading your infrastructure, the right tools are already available to you both in the terminal and in the GUI. Performing regular disk benchmarks helps you spot performance drops early and optimize your system's storage for real-world performance.
Pick the tool that matches your goal. Quick gut check? dd or hdparm. Real engineering decision? fio, every time. Visual report for a client or your own desktop? GNOME Disks or KDiskMark. And if your benchmarks keep coming back disappointing despite a healthy drive, the storage tier itself might be the ceiling that's usually when it's time to move from shared SATA to an NVMe-backed plan. Explore our Linux VPS Hosting solutions designed for speed, reliability, and scalability.
People also read:

Leave A Comment