

The Linux ps command prints a snapshot of the processes running when you type it. Use it to check whether a service is up, find what's eating memory, or get a PID before you run kill. These commands cover most day-to-day work:
ps                     # processes in your current shell
ps -e                  # every process on the system
ps aux                 # BSD-style full view with CPU and memory
ps -ef                 # UNIX-style full listing with PPID
ps aux --sort=-%mem    # biggest memory users first
ps -eLf                # every thread
ps --ppid 1234         # direct children of PID 1234
For other essentials, see our Basic Linux Commands with Examples [Linux Cheat Sheet]. If you're new to the platform, start with how to use Linux.
🎯 What Is the ps Command in Linux?
The man page describes ps as a tool to "report a snapshot of the current processes." On most Linux distributions it comes from the procps (or procps-ng) package and reads its data from /proc.
What ps shows by default
With no options, ps lists only processes that share your effective user ID and terminal. That's usually your shell and ps itself, in four columns: PID, TTY, TIME and CMD. For related file operations, the touch command in Linux handles creating files and updating timestamps.
Snapshot vs real-time monitoring
The output never refreshes. To watch a process climb in CPU usage, use top or htop, or wrap ps in watch. Reach for ps when you need output you can grep, pipe into a script, or paste into a ticket. For a broader picture of monitoring tools, see Linux monitoring.
| Tool | Best for | Updates live? |
ps |
Scriptable snapshots, filtering, custom columns | No |
top |
Quick live view, installed almost everywhere | Yes |
htop |
Interactive sorting, tree view, killing processes | Yes |
pgrep |
Getting PIDs by name or parent | No |
pstree |
Visual parent/child hierarchy | No |
⚙️ Linux ps Syntax and Option Styles
The basic form is ps [options]. The confusing part is that procps ps accepts three option families, and you can mix them:
- UNIX options, which take a single dash and can be grouped:
ps -ef - BSD options, which take no dash:
ps aux - GNU long options, which take two dashes:
ps --sort=-%cpu
ps aux vs ps -ef vs ps -aux
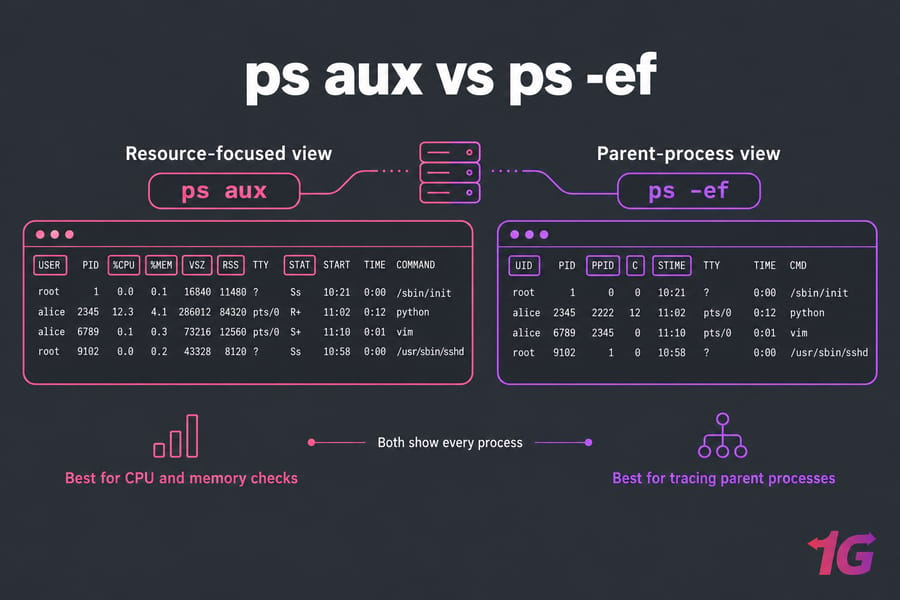
ps aux and ps -ef both list every process. aux adds %CPU, %MEM, VSZ, RSS and STAT, so it suits resource questions. -ef shows PPID, so it suits tracing parent processes.
ps -aux is a different command. The man page says plainly that "ps -aux is distinct from ps aux." Under POSIX, -aux asks for processes owned by a user named "x". If that user doesn't exist, ps may treat the command as ps aux and print a warning. It works by accident — drop the dash.
📊 How to Understand ps Output Columns
| Column | Meaning | Why it matters |
| PID | Process ID | What you pass to kill |
| PPID | Parent process ID | Shows who started the process |
| USER / UID | Owner of the process | Spot services running as root |
| %CPU | CPU time divided by time the process has existed | An average over its lifetime, not a current reading |
| %MEM | Resident memory as a share of physical RAM | Quick way to find memory hogs |
| VSZ | Virtual memory size in KiB | Often large and misleading |
| RSS | Resident set size: physical RAM in use, in KiB | The figure to watch for memory pressure |
| TTY | Controlling terminal | ? means a daemon with no terminal |
| STAT | Process state (R running, S sleeping, D uninterruptible, Z zombie, T stopped) | Find stuck or defunct processes |
| START / STIME | Start time | Tells you when a service last restarted |
| TIME | Total CPU time consumed | Separates busy processes from idle long-runners |
| CMD / COMMAND | Command with arguments | Shows what the process really is |
In custom output, comm gives just the executable name and args (alias cmd) gives the full command line.
What square brackets mean
Names like [kthreadd] or [kworker/0:1] mean ps couldn't read any command-line arguments — usually kernel threads, though defunct processes show up the same way.
💡 Useful Linux ps Command Examples
The commands below run in any standard shell. For shell scripting background, see our Bash commands guide.
Listing all processes
ps -A
ps -e
Both display all processes running on the system.
Advanced options: full details
ps -ef    # full-format listing with PPID, UID
ps aux    # snapshot of all processes with user info and resources
Sorting processes
ps aux --sort=-%mem       # by memory usage, descending
ps aux --sort=comm        # alphabetically by command name
ps aux --sort=start_time  # by start time
ps aux --sort=-%cpu       # by CPU usage, descending
The minus sign in --sort means descending order.
Picking your own columns
ps -eo pid,ppid,%cpu,%mem,cmd
ps -eo pid,comm,lstart    # full start date and time
ps -eo pid,comm,etime     # elapsed time since start
ps -C nginx               # processes named exactly "nginx"
ps -p 1234                # one specific PID
ps -u root                # processes owned by root
-o takes a comma-separated list of columns. Appending = to a column hides its header, so ps -C sshd -o pid= gives bare PIDs for scripts. If command lines get cut off at the terminal edge, add ww: ps auxww.
🧵 How to Show Threads and Child Processes
Listing threads
ps -T -p <PID>       # threads of one process; SPID column
ps -eLf              # all processes with all threads
ps -eo pid,tid,comm  # custom thread view
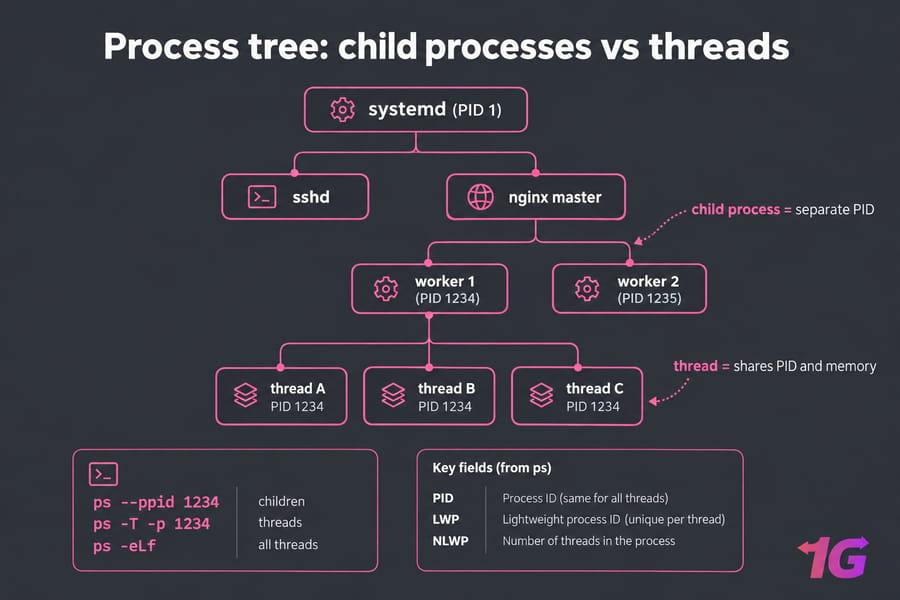
A thread shares its parent's PID and memory. LWP is the thread ID, NLWP the thread count.
Listing child processes
ps --ppid <PPID>     # direct children of a PID
pgrep -P <PPID>      # same, PIDs only
pstree -p <PPID>     # tree with PIDs, rooted at <PPID>
ps -ejH              # indented process hierarchy
ps axjf              # BSD-style ASCII tree
A common mix-up: top -H -p 1234 shows the threads of PID 1234, not its children. The /proc filesystem also exposes child PIDs directly via /proc/<PID>/task/<TID>/children.
Shell scripting example
CHILDREN=$(ps --ppid <PPID> -o pid=)
for PID in $CHILDREN; do
  echo "Child PID: $PID"
done
🎛️ Controlling the Output
Format options
ps -o specifies exact columns:
ps -o pid,cmd,%cpu,%memControlling output width
ps -w increases output width. Using -ww makes it unlimited, preventing truncation of long command lines.
Filtering output
ps -u john       # processes owned by user john
ps -C firefox    # processes running the firefox command
Sorting output
ps aux --sort=-%memOutput redirection
ps aux > output.txtRedirect output to a file when you need to review it later or process it.
👤 Effective vs Real User Name
The ps command provides information about the user who owns each process. Two identifiers matter:
Real User ID (UID)
The user ID of the user who started the process. It's used for permissions and access control. ps aux displays the real user name by default; ps -o uid,pid,cmd shows the numeric UID.
Effective User ID (EUID)
Determines the permissions and capabilities of the process during execution. It can differ from the real UID if a process runs with elevated privileges — for example, setuid programs. ps doesn't display EUID by default; use ps -eo euid,pid,cmd.
Displaying both
ps -o uid,euid,pid,cmdUnderstanding these identifiers is crucial for managing permissions and debugging process-related issues. For related permission work, see the chown command, which changes file ownership efficiently.
🔧 Troubleshooting Workflows with ps
Check if a process is running
ps aux | grep nginx works but also matches the grep line itself. pgrep -a nginx is cleaner and exits non-zero when nothing matches, which suits shell scripts. For systemd services, systemctl status nginx tells you more.
Identify high-memory processes
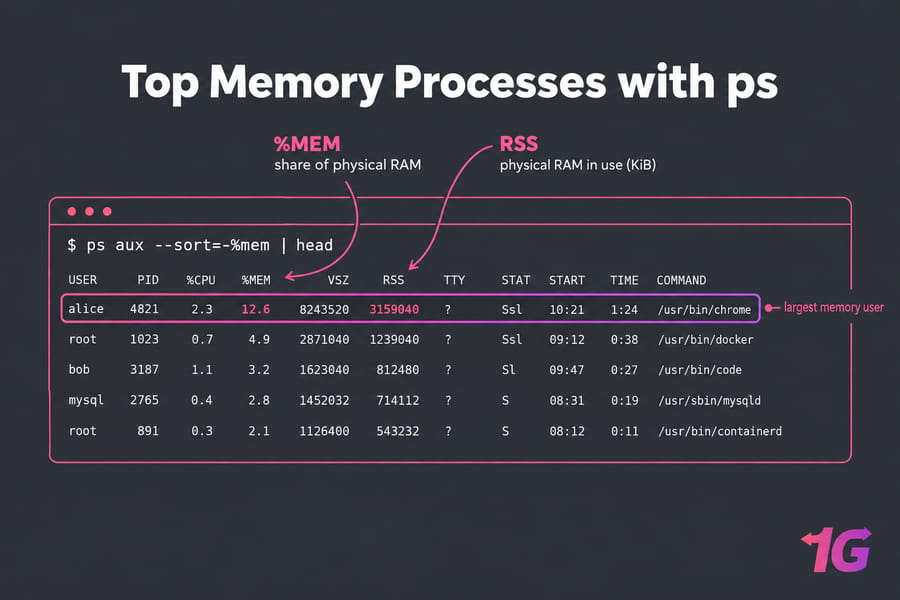
Run ps -eo pid,user,rss,%mem,cmd --sort=-rss | head. Sorting by RSS instead of VSZ shows real RAM use.
Find zombie or defunct processes
ps -eo pid,ppid,stat,cmd | awk '$3 ~ /^Z/'You can't kill a zombie — it has already exited. Its parent (the PPID) hasn't collected the exit status, so restarting or fixing that parent clears it. Also check for processes in state D, which are usually stuck waiting on disk or NFS I/O.
Repeat a ps check with watch
watch -n 2 'ps -eo pid,%cpu,%mem,cmd --sort=-%cpu | head'This reruns the snapshot every two seconds, giving you top-style refreshes with your own columns. For more on the dynamic monitoring tool, see the Linux top command. For interval-based command execution, see the Linux watch command.
⚠️ Limitations of the ps Command
- Each run is a single point in time. It doesn't refresh automatically — for real-time monitoring, use
toporhtop. - %CPU is a lifetime average. A process that just spiked can look calm. Use
topfor current load. - Limited output width by default. Long command lines are truncated to terminal width unless you add
ww. - Cross-platform differences. Procps on Linux and
pson BSD or macOS differ in output and options, so scripts using GNU long options may not carry over. - Default scope is your own processes. Without
-eor-A,psonly shows processes owned by your user. - Performance overhead on busy systems.
ps auxorps -efon hosts with thousands of processes can be slow, especially when run frequently in scripts. - Limited context about hierarchy. Default output doesn't show parent-child relationships; combine with
pstreeor useps -ejH. - Complex
-ocolumn names. Few people remember them. Bookmark the ps man page or runps Lto list available columns.
🔗 Related Commands
pgrep and pkill find and signal processes by name, user or parent. kill PID sends SIGTERM to one process, and kill -9 is the last resort. pstree draws hierarchies. For live monitoring, top ships with procps, and htop adds mouse support, color and a tree view. To kill a runaway process: find it with ps aux --sort=-%cpu, check its PPID with ps -o ppid= -p PID, and send kill to whichever process should actually go.
For filtering the output of ps or any other command, see our guide on the Grep Command in Linux.
🧩 Conclusion
The ps command is a fundamental tool for monitoring and managing processes in Linux. By providing detailed snapshots of current processes, it lets you track system performance, identify issues, and manage resources effectively. Its flexibility shows through ps aux and ps -ef, which offer different levels of detail for different needs. While ps is powerful, it has limitations — a static view, truncated long command lines, and no real-time refresh. For dynamic monitoring, top or htop complement it. Understanding and using ps effectively is crucial for system administrators and power users. To further enhance your command-line proficiency, learn about the YUM command in Linux for managing software packages. For a reliable environment to practice on, explore Linux VPS hosting from 1GBits — full root access and dedicated resources.

Leave A Comment